International Journal of Science, Engineering and Technology Research (IJSETR)
Volume 1, Issue 1, July 2012
Geometric Design of Runway for Nay Pyi Taw
Airport
Moe Sandar, Kay Thwe Tun
Abstract - Nay Pyi Taw is the capital of Myanmar. It is
necessary to have an international airport to promote the
communications and transportation with the other countries.
For the development of transportation, geometric design of
runway is studied for Nay Pyi Taw Airport. Moreover, runway
orientations, runway configuration, runway marking are also
studied. Two methods of International Civil Aviation
Organization (I.C.A.O) and Federal Aviation Administration
(FAA) are considered in geometric design. On the basis of wind
intensity, duration and direction to obtain best runway
orientation, wind rose diagram is chosen by using Method I and
Method II of VIRENDRA KUMAR and SATISH CHANDRA.
This wind data is obtained from the department of Meteorology
and Hydrology during five years. The configuration type of
runway is a single runway. Marking are designed base on the
ICAO specifications.
Keywords- Runway orientation, runway configuration,
runway geometric design, runway marking
I. INTRODUCTION
Transportation is essential for a nation’s development and
growth. Air transportation, land transportation, water
transportation and pipelines are the world’s four mode of
transport and every mode has its own weakness and
advantages. Air transportation and water transportation are
the modes of transport mainly with foreign countries. Air
travel can be separated into two general classifications
national and international flights. Flights from one point to
another within the same country are called domestic flights.
Flights from a point in one country to a point within a different
country are known as international flights. When cars are
invented, scientists and engineers had to design a ground
transportation system with roads and traffic rules. A similar
system was designed for air transportation. Therefore, air
transportation plays an important role of transportation
system. Nowadays, new airports and expending ones in large
numbers have also been built in Myanmar. Properly designed
airport geometry provides optimum efficiency in traffic
operation with maximum safety. Geometric design of runway
is considered as the major part of the design of runway.
Runway orientation, runway configuration and runway
marking are also considered in geometric design.
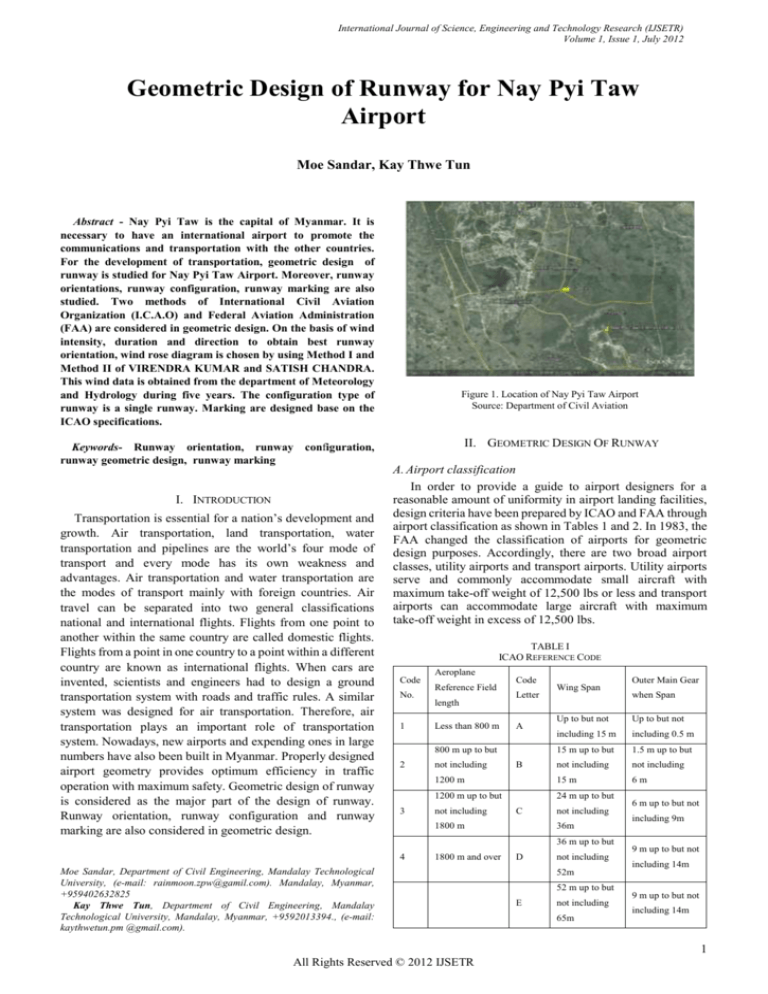
Figure 1. Location of Nay Pyi Taw Airport
Source: Department of Civil Aviation
II. GEOMETRIC DESIGN OF RUNWAY
A. Airport classification
In order to provide a guide to airport designers for a
reasonable amount of uniformity in airport landing facilities,
design criteria have been prepared by ICAO and FAA through
airport classification as shown in Tables 1 and 2. In 1983, the
FAA changed the classification of airports for geometric
design purposes. Accordingly, there are two broad airport
classes, utility airports and transport airports. Utility airports
serve and commonly accommodate small aircraft with
maximum take-off weight of 12,500 lbs or less and transport
airports can accommodate large aircraft with maximum
take-off weight in excess of 12,500 lbs.
TABLE I
ICAO REFERENCE CODE
Code
No.
1
Aeroplane
Reference Field
length
Less than 800 m
Code
Letter
A
800 m up to but
2
not including
B
1200 m
1200 m up to but
3
not including
Wing Span
1800 m
Up to but not
including 15 m
including 0.5 m
15 m up to but
1.5 m up to but
not including
not including
15 m
6m
not including
36m
36 m up to but
4
1800 m and over
Moe Sandar, Department of Civil Engineering, Mandalay Technological
University, (e-mail: rainmoon.zpw@gamil.com). Mandalay, Myanmar,
+959402632825
Kay Thwe Tun, Department of Civil Engineering, Mandalay
Technological University, Mandalay, Myanmar, +9592013394., (e-mail:
kaythwetun.pm @gmail.com).
D
not including
52m
52 m up to but
E
when Span
Up to but not
24 m up to but
C
Outer Main Gear
not including
65m
6 m up to but not
including 9m
9 m up to but not
including 14m
9 m up to but not
including 14m
1
All Rights Reserved © 2012 IJSETR
International Journal of Science, Engineering and Technology Research (IJSETR)
Volume 1, Issue 1, July 2012
TABLE II .
FAA AIRPLANE DESIGN GROUPS FOR GEOMETRIC DESIGN OF AIRPORTS
Airplane
Design
Group
I
II
III
IV
V
V
Wing Span(ft)
Less than 49
49 up to 79
79 up to 118
118 up to 171
171 up t0 214
214 up to 262
Typical Aircraft
In this study, shoulders (25 ft) are designed according to code
letter E.
E. Runway Configuration
Beech Bonan ZaA 35 Learjet 25
Deltavilland Dit C-5 Gulf stream
Boeing 737, Martin-04
Boeing 757,Lockheed1011
Boeing 747-400
Lockheed C5A
In this study, the design aircraft is Boeing 747-400. Its
wing span is 211 feet, 5 inches. According to Table 1 and 2,
the airport classification number 4E and airplane design
group V are chosen by wing span.
This reference code will be used in consideration of the
geometric design. Moreover, the maximum take-off weight of
the design aircraft is more than 12,500 lbs. So, Nay Pyi Taw
airport is transport airport.
Following are four basic runway patterns and most runway
systems are arranged according to them.
1. Single runway
2. Parallel runways
3. Intersecting runways
4. Non intersecting runways
In this study, the number of runways depends on the volume
of traffic. Annual Departure of Nay Pyi Taw Airport is 1200
operations. So traffic requirement do not exceed 50 to 100
operations per hour. Therefore, runway configuration is taken
as a single runway.
B. Runway length
The runway length is one of the most significant factors in
the size and cost of the airport. The length of runway should
be sufficient for take-off and landing of critical aircraft
desiring service at the airport. Large variations in required
runway length may be caused by local factors that influence
the performance of aircraft. To estimate the actual runway
length, the following equation must be used.
158˚
Actual runway length = Aeroplane reference field length×
(Ft× Fe× Fg)
(1)
In this study, reference field length of design aircraft is
8800 ft. From the meteorological data of Nay Pyi Taw
Airport, Monthly mean of mean daily temperature, T 1 and
Monthly mean of maximum daily temperature, T2 are 37.7 C˚
and 40.5 C˚. So, Correction for temperature, Ft is 1.24. Nay
Pyi Taw lies on plateau 109 ft above sea level. According to
sea level, correction for elevation, Fe is 1.02. The correction
factor for gradient, Fg is also 1. Therefore, actual runway
length is designed as 12000 ft by using equation 1.
C .Runway width
The width of a runway should not be less than the
appropriate dimension specified in Table 3.
TABLE III
WIDTH OF RUNWAY (ICAO) IN METER
Code
no
1
2
3
4
A
18
23
30
-
B
18
23
30
-
Code letter
C
23
30
30
45
D
45
45
E
45
According to code no 4 and code letter E, runway width of
Nay Pyi Taw Airport is 200 ft.
D. Width of runway shoulder
The runway shoulders shall extend symmetrically on each
side of the runway so that the overall width of the runway and
its shoulder is not less than 60 m where the code letter is D or
E and 75 m where the code letter is F.
Figure2. Runway Configuration of Nay Pyi Taw Airport
F. Runway Markings
Runway markings are the following types.
1. Runway centreline marking
2. Runway side strip marking.
3. Aiming Point marking
4. Runway threshold marking
5. Runway touchdown zone marking
1. Runway centreline marking
It consists of a line uniformly spaced stripes and gaps and
of uniform width. The length of a strip plus a gap shall not be
less than 165 ft and no more than 250 ft. It locates along the
physical centre of the runway. The minimum widths of stripes
are 3 ft for precision runway, 1.5 ft for non precision runway,
and 1 ft for visual runway.
In this study, length- 100 ft, width- 3 ft, and spacing 100 ft
are designed for runway centreline marking.
2. Runway side stripes marking
It consists of continuous white lines along each side of the
runway. The minimum width of strip is 3 ft for
precision-instrument runways and at least as wide as the
centerline stripes on other runways. So, these stripes are
designed as 3 ft in this study.
3. Aiming point marking
A runway aiming point marking provides a visual aiming
point for landing operations. ICAO recommended location
and dimension of aiming point marking as shown in Table 4.
2
All Rights Reserved © 2012 IJSETR
International Journal of Science, Engineering and Technology Research (IJSETR)
Volume 1, Issue 1, July 2012
TABLE IV
LOCATION AND DIMENSION OF THE AIMING POINT MARKING
100133 ft
13 ft
20 ft
100- 150
ft
20 ft
30 ft
150- 200
ft
20- 23 ft
60- 75 ft
150- 200
ft
20- 23 ft
60- 75 ft
1333 ft
DEC
NE
3.0
NE
5.0
SE
4.8
NE
NW
31.0
4.8
NOV
NW
4.0
NE
4.0
NE
3.6
SE
NE
4.0
4.8
OCT
SE
5.0
SE
5.0
SW
6.0
S
NE
11.0
3.6
SEP
NE
3.0
SE
4.0
SW
4.8
NE
SW
15.0
4.8
AUG
SE
5.0
SE
5.0
SE
4.8
NE
SE
1.0
4.8
JUL
SE
4.0
NW
5.0
SE
15.6
SE
NE
11.0
4.8
JUN
S
9.0
S
10.0
SW
6.0
SW
7.2
MAY
SE
3.0
SE
3.0
SW
4.8
SE
APR
SE
4.8
NE
3.2
SW
7.2
SE
MAR
N
4.9
N
4.9
S
16.0
SE
FEB
SE
3.0
SE
6.0
SE
4.0
SE
JAN
NW
2.4
SE
6
20.0
8000 ft or more
3.6
4
NW
5000ft≤ length < 8000 ft
13.0
3
4.8
4000ft≤ length < 5000 ft
SE
2
19.0
3000 ft≤ length < 4000 ft
6.0
1
NE
Less than 3000 ft
7.0
Pair(s) of markings
3.6
Landing distance available
NW
TABLE VI
PAIRS OF MARKING FOR LANDING DISTANCE AVAILABLE
17.0
5. Runway touchdown zone marking
Runway touchdown zone markings are white and consist of
groups of one, two, and three rectangular bars symmetrically
arranged in pairs about the runway centerline. These markings
are designed by landing distance available as shown in Table
6.
2008
Year
In this study, the width of runway is 60 ft. So, runway
threshold marking is shown in Table 5 according to ICAO.
NE
3.6
3.6
3.6
3.6
3.6
3.6
2009
30
30
30
30
30
30
2.4
4
6
8
12
16
24
2010
18
23
30
45
60
90
Width of
centre gap
5.0
Length of
stripes
2011
No. of
stripes
TABLE VII
MONTHLY MAXIMUM WIND SPEED (MPH) AND DIRECTION FOR PYIN MA
NAR STATION
3.6
Runway
Width
Width of
and
distance
between
stripes
1.8
1.8
1.8
1.8
1.8
1.8
G. Runway Orientation
To determine the runway orientation, wind data must be
analyzed at least during five years. The monthly maximum
wind speed (mph) and direction for Pyinmana are shown in
Table 7.
SE
Table V
RUNWAY GEOMETRIC STANDARDS ( ICAO ) METER
Figure 3. Runway markings for Nay Pyi Taw Airport
SE
In this study, length (200 ft), width (200 ft), and spacing
are designed as aiming point marking.
4. Runway threshold marking
It consists of a pattern of longitudinal stripes of uniform
dimensions spaced symmetrically about the runway
centerline. The number of longitudinal stripes and their
spacing are determined by the runway width as shown in
Table 5.
NE
Width of stripe
Lateral spacing
between inner
sides of stripes
8000
ft
and above
500 ft
4000 ft
up to but
not
including
8000ft
1000 ft
2012
Distance from
threshold to the
beginning of
marking
Length of stripe
2667 ft
up to but
not
including
4000ft
833 ft
4.0
Landing distance available
Location and Less
dimension
than
2667
ft
In this study, landing distance available is more than 8000
ft. Therefore, markings are designed as 6 pairs. All marking is
shown in Figure 3.
Source: Department of Meteorology and Hydrology
Wind direction, range of wind intensity and percentage of
winds are shown in Table 8.
3
All Rights Reserved © 2012 IJSETR
International Journal of Science, Engineering and Technology Research (IJSETR)
Volume 1, Issue 1, July 2012
TABLE VIII
ANALYSIS OF WIND DATA
Col 1
Wind
direction
N
NNE
NE
ENE
E
ESE
SE
SSE
S
SSW
SW
WSW
W
WNW
NW
NNW
Total
Percentage of wind
Col 2
Col 3
Col 4
Calm
4 mph- 15
15 mphperiod
mph
25 mph
(0-4 mph )
3.33
16.67
8.33
15.00
26.67
1.67
1.67
3.33
1.67
1.67
10.00
5
1.67
8.33
1.67
43.34%
Col 5
Total
3.33
8.33
28.34
5.00
10.00
1.67
1.67
56. 67%
In the comparison of Method I and Method II, Method I is
the absence of data on wind velocity and the effect of cross
wind component. Method II used the wind velocity, direction,
duration and effect of cross wind component. Method I is
rough guide because of lack of some data.
Method II is adequate compare with Method I due to the
complement of data so the best runway orientation of Nay Pyi
Taw Airport is chosen as the NNW-SSE (338- 158).
Percentage of wind is determined by using Table VII. In the
determination of the runway orientation, 15 mph is taken as
the allowable cross wind and calm period is 0-4 mph.
H. Determination of the best runway orientation by using
method
Method I uses the data on the direction and frequency of
wind from Table 8. Using this data, Wise Rose diagram for
method I can be drawn in Figure 4. In Wind Rose diagram, the
radial lines indicate the wind direction and frequency of wind
is marked to some suitable scale on these lines. All plotted
points are joined by straight lines. The best runway
orientation is along the direction of the longest line on the
Wind Rose diagram .
In the figure the best orientation of runway is along NW-SE
(315˚-135˚).
Figure 5. Wind Rose Diagram for Nay Pyi Taw Airport
by using Method II
IV. CONCLUSION
Nay pyi Taw International Airport is located 12 miles from
the South of Nay Pyi Taw City. Expecting the landing and
take-off the Boeing 747-400 at Nay Pyi Taw International
Airport, this design is prepared to submit. In this study, two
methods of International Civil Aviation Organization (ICAO)
and Federal Aviation Administration (FAA) are used. Runway
orientation, runway configuration, runway geometric design, and
marking are considered. On the basic of the wind intensity,
direction and duration, the best runway orientation is 338˚-158˚.
The configuration type of runway is a single depending upon
the volume of traffic. The runway length of 12000 ft and
width of 200 ft will be adequate to allow safe landing and
take-off. Runway marking depends upon the runway length
and width.
ACKNOWLEDGEMENT
Figure.4 Wind Rose Diagram by using Method I
I. Determination of the best runway orientation by using
method II
Method II uses the data on the direction, velocity and
duration of wind from Table 8. Wind Rose diagram for
method II can be shown in Figure 5. In Figure5, the circles
represent wind velocity and the radial lines indicate wind
direction. According to Figure III, the best runway orientation
of Nay Pyi Taw Airport is chosen as the NNW-SSE (338158).
The author wishes to express her deep gratitude to her
Excellency, Minister Dr. Ko Ko Oo, Ministry of Science and
Technology, for opening the Master of Engineering course at
Mandalay Technological University.
The author would like to express her profound gratitude to
Dr.Myint Thein, rector of Mandalay Technological University,
for his encouragement and managements.
The author also wishes to express gratitude to Dr. Kyaw Moe
Aung, Associate Professor and Head of Department of Civil
Engineering, Mandalay Technological University for his helpful
advice, management and encouragement.
4
All Rights Reserved © 2012 IJSETR
International Journal of Science, Engineering and Technology Research (IJSETR)
Volume 1, Issue 1, July 2012
The author also wishes to record the greatest and special
thanks and owe in gratitude to her supervisor, Dr. Kay Thwe
Htun, Lecturer, Department of Civil Engineering, Mandalay
Technological University, for her careful guidance, advices and
invaluable encouragement.
The author specially thanks to her teachers from Civil
Engineering department for their supports and encouragements to
attain her destination. Finally, the author specially thanks to all
her teachers and her family, especially her parents, for their
supports and encouragement.
REFERENCES
[1]
[2]
[3]
[4]
Kumar, V. And Chandra, S. 1999. Air Transportation Planning and
Design. 1st ed. New Delhi: Galgotia Publications Pvt.Ltd.
Anonymous. 1988. Preliminary Information Boeing-747-400. U.S.A:
Boeing Commercial Airplane Company.
Anonymous. 1983. Aerodrome Design Manual. Part 3. Canada:
International Civil Aviation Organization.
Smokiat, L. 1993. Geometric Design of Aircraft Movement
Areas. 15th ed. Singapore: Airport Engineering Course.
5
All Rights Reserved © 2012 IJSETR

