Table:
advertisement
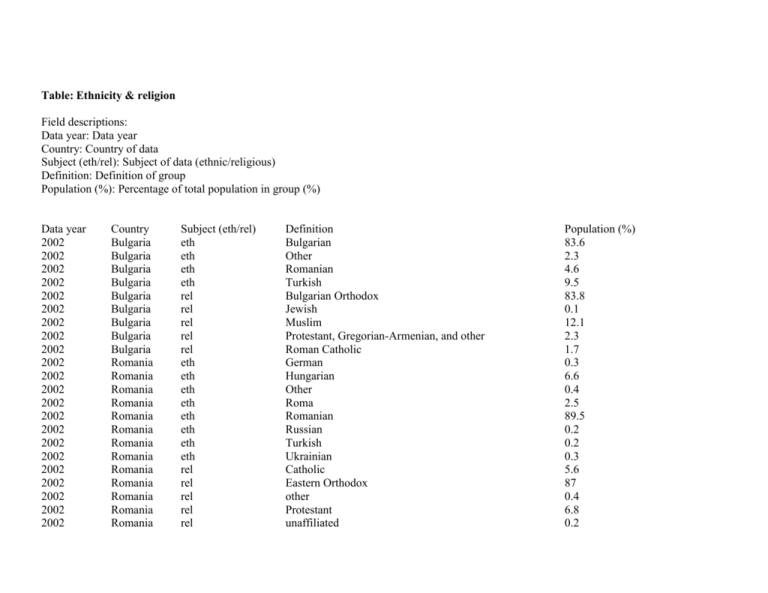
Table: Ethnicity & religion Field descriptions: Data year: Data year Country: Country of data Subject (eth/rel): Subject of data (ethnic/religious) Definition: Definition of group Population (%): Percentage of total population in group (%) Data year 2002 2002 2002 2002 2002 2002 2002 2002 2002 2002 2002 2002 2002 2002 2002 2002 2002 2002 2002 2002 2002 2002 Country Bulgaria Bulgaria Bulgaria Bulgaria Bulgaria Bulgaria Bulgaria Bulgaria Bulgaria Romania Romania Romania Romania Romania Romania Romania Romania Romania Romania Romania Romania Romania Subject (eth/rel) eth eth eth eth rel rel rel rel rel eth eth eth eth eth eth eth eth rel rel rel rel rel Definition Bulgarian Other Romanian Turkish Bulgarian Orthodox Jewish Muslim Protestant, Gregorian-Armenian, and other Roman Catholic German Hungarian Other Roma Romanian Russian Turkish Ukrainian Catholic Eastern Orthodox other Protestant unaffiliated Population (%) 83.6 2.3 4.6 9.5 83.8 0.1 12.1 2.3 1.7 0.3 6.6 0.4 2.5 89.5 0.2 0.2 0.3 5.6 87 0.4 6.8 0.2 Country: Bulgaria Year(s): 2002 Source: Central Intelligence Agency 2003. World Fact Book 2002. URL: http://www.cia.gov/cia/publications/factbook/ Country: Romania Year(s): 2002 Source: Central Intelligence Agency 2003. World Fact Book 2002. URL: http://www.cia.gov/cia/publications/factbook/ Table: Dwellings by age Field descriptions: Data year: Data year Country: Country of data Construction year: Period of construction Dwellings (N): Total number dwellings (of this timeframe) year 2001 2001 2001 2000 2000 2000 2000 2000 2000 1992 Country Bulgaria Bulgaria Bulgaria Bulgaria Bulgaria Bulgaria Bulgaria Bulgaria Bulgaria Romania Construction year -1919 1919-1945 1971-1980 1946-1960 1961-1970 1981-1985 1986-1990 1991-1995 1996-2000 -1919 Dwellings (N) 90000 406000 832000 986000 679000 134000 188000 64000 33000 479910 1992 1992 1992 1992 1992 1992 1992 1992 Romania Romania Romania Romania Romania Romania Romania Romania 1919-1945 1946-1960 1961-1970 1971-1980 1981-1985 1986-1990 1991-1995 unknown 806410 1289940 1550150 1803600 713430 493410 49900 472240 Table sources: Country: Bulgaria Year(s): 2000, 2001 Source: UNECE 2004. Human Settlements Database. URL: http://w3.unece.org/stat/HumanSettlements.asp Country: Romania Year(s): 1992 Source: UNECE 2004. Human Settlements Database. URL: http://w3.unece.org/stat/HumanSettlements.asp This table is downloaded from the ExpoFacts database in the Thursday 06th of March 2008 The used sources and copyright information can be found after the table data Table: Life expectancies Field descriptions: Data year: Data year Country: Country of data Gender (m/f): Gender of group (male/female) At 0: Life expectancy (years) at age of 0 year At 1: Life expectancy (years)at age of 1 year At 5: Life expectancy (years) at age of 5 years At 10: Life expectancy (years) at age of 10 years At 15: Life expectancy (years) at age of 15 years At 20: Life expectancy (years) at age of 20 years At 25: Life expectancy (years) at age of 25 years At 30: Life expectancy (years) at age of 30 years At 35: Life expectancy (years) at age of 35 years At 40: Life expectancy (years) at age of 40 years At 45: Life expectancy (years) at age of 45 years At 50: Life expectancy (years) at age of 50 years At 55: Life expectancy (years) at age of 55 years At 60: Life expectancy (years) at age of 60 years At 65: Life expectancy (years) at age of 65 years At 70: Life expectancy (years) at age of 70 years At 75: Life expectancy (years) at age of 75 years At 80: Life expectancy (years) at age of 80 years At 85: Life expectancy (years)at age of 85 years At 90: Life expectancy (years) at age of 90 years At 95: Life expectancy (years)at age of 95 years At 100: Life expectancy (years) at age of 100 years HALE 0: Healthy life expectancy at birth (years) HALE 60: Healthy life expectancy at age of 60 (years) Data year Country At 0 At 1 At 5 At 10 At 15 At 20 At 25 At 30 At 35 At 40 At 45 At 50 At 55 At 60 At 65 At 70 At 75 At 80 At 85 At 90 Bulgaria Gen der (m/f ) f 2000 2001 74. 91 74. 89 71. 18 66. 28 61. 38 56.5 51. 63 46. 78 41. 99 37. 25 32. 6 28. 05 23.7 19. 57 15. 62 12 8.88 6.55 4.81 3.71 2000 2001 2000 2001 2000 2001 Bulgaria m 67. 35 67. 56 63. 83 58. 96 54. 07 49.3 44.6 39. 88 35. 26 30. 75 26. 47 22. 44 18. 78 15.5 12. 53 9.76 7.42 5.71 4.39 Romania f 73. 46 73. 74 70. 02 65. 18 60. 33 55. 46 50. 58 45. 73 40. 92 36. 21 31. 64 27. 23 22. 95 18. 86 15 11. 51 8.48 6.06 Romania m 66. 25 66. 63 62. 93 58. 15 53. 36 48.6 43. 86 39. 18 34. 56 30. 17 26. 08 22. 26 18.7 15. 45 12. 52 9.86 7.52 5.5 At 95 At 100 95 HA LE 0 HA LE 60 2.81 2.1 65.2 13.9 3.57 2.8 2.13 60.8 11.5 4.3 3.06 2.31 1.82 63.3 13.5 4.03 2.96 2.28 1.82 58.6 11.1 Table sources: Country: Bulgaria Year(s): 2000-2001 Source: WHO Life Tables URL: http://www3.who.int/whosis/life/life_tables/life_tables.cfm Country: Romania Year(s): 2000-2001 Source: WHO Life Tables URL: http://www3.who.int/whosis/life/life_tables/life_tables.cfm This table is downloaded from the ExpoFacts database in the Thursday 06th of March 2008 The used sources and copyright information can be found after the table data Table: Unemployment by age group Field descriptions: Data year: Data year Country: Country of data Age (years): Age group of population (years) Gender (m/f): Gender of group (male/female) Unemployed (N): Number of unemployed Data year 2001 2001 2001 2001 2001 2001 2001 2001 2001 2001 2001 2001 2001 2001 2001 2001 2001 2001 2001 2001 2001 2001 2001 2001 2001 2001 2001 2001 2001 2001 2001 2001 Country Bulgaria Bulgaria Bulgaria Bulgaria Bulgaria Bulgaria Bulgaria Bulgaria Bulgaria Bulgaria Bulgaria Bulgaria Bulgaria Bulgaria Bulgaria Bulgaria Bulgaria Bulgaria Bulgaria Bulgaria Bulgaria Bulgaria Bulgaria Bulgaria Romania Romania Romania Romania Romania Romania Romania Romania Age (years) 15-19 15-19 20-24 20-24 25-29 25-29 30-34 30-34 35-39 35-39 40-44 40-44 45-49 45-49 50-54 50-54 55-59 55-59 60-64 60-64 65-69 65-69 tot tot 15-19 15-19 20-24 20-24 25-29 25-29 30-34 30-34 Gender (m/f) f m f m f m f m f m f m f m f m f m f m f m f m f m f m f m f m Unemployed (N) 20400 16600 40500 63300 36500 50300 35700 41300 34300 39000 37200 42000 39000 39000 36900 37000 14200 26300 2600 6300 700 2100 297800 363200 33400 49200 77000 101700 37100 71000 50500 63100 2001 2001 2001 2001 2001 2001 2001 2001 2001 2001 2001 2001 2001 Romania Romania Romania Romania Romania Romania Romania Romania Romania Romania Romania Romania Romania 35-39 35-39 40-44 40-44 45-49 45-49 50-54 50-54 55-59 55-59 60 tot tot f m f m f m f m f m m f m 31800 29200 40100 46500 29700 42300 12300 23300 2100 7700 2100 313900 436100 Table sources: Year(s): 2001 Source: ILO 2002. Yearbook of Labour Statistics 2002/ Laborsta Internet. URL: http://laborsta.ilo.org "Copyright: Copyright © 2002 International Labour Organization, The ILO shall accept no responsibility for any inaccuracy, errors or omissions or for the consequences arising from the use of the data.""""" Country: Romania Year(s): 2001 Source: ILO 2002. Yearbook of Labour Statistics 2002/ Laborsta Internet. URL: http://laborsta.ilo.org "Copyright: Copyright © 2002 International Labour Organization, The ILO shall accept no responsibility for any inaccuracy, errors or omissions or for the consequences arising from the use of the data. Table: Urban/Rural - distribution Field descriptions: Data year: Data year Country: Country of data Urban-%: Percentage of urban population (%) Rural population-%: Percentage of rural population (%) Data year 2000 2000 Country Bulgaria Romania Urban population-% 67 55 Table sources: Country: Bulgaria Year(s): 2000 Source: UNECE 2004. Demographic Database. URL: http://w3.unece.org/stat/pau.asp Country: Romania Year(s): 2000 Source: UNECE 2004. Demographic Database. URL: http://w3.unece.org/stat/pau.asp Rural population-% 33 45
