Final Exam - Mathspace
advertisement

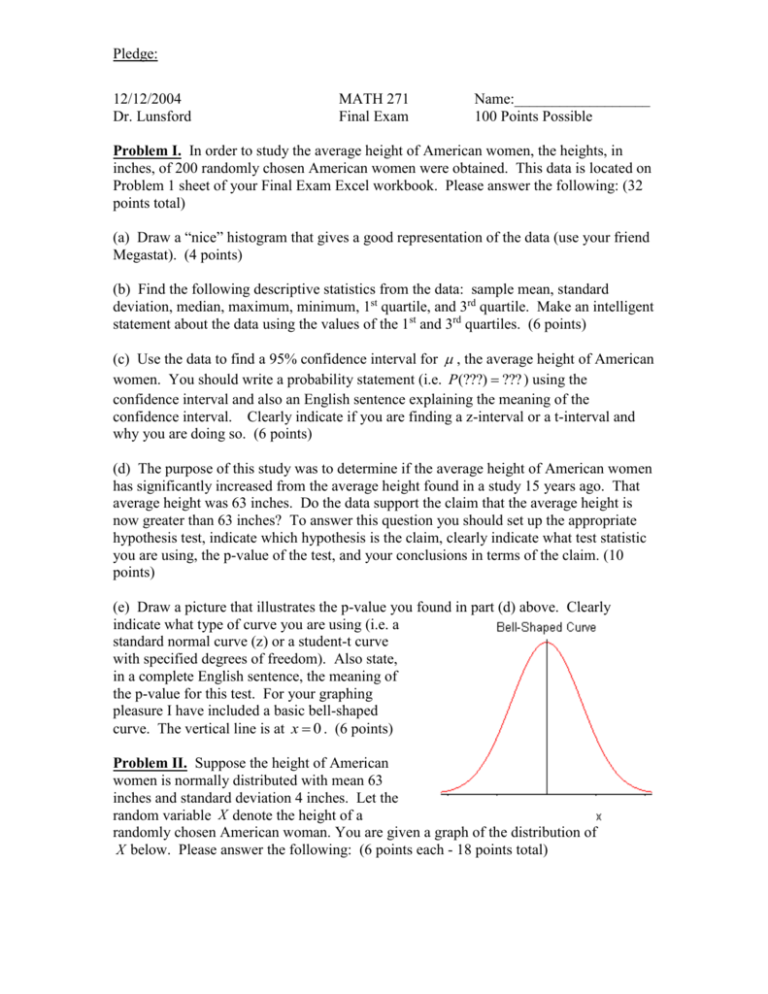
Pledge: 12/12/2004 Dr. Lunsford MATH 271 Final Exam Name:__________________ 100 Points Possible Problem I. In order to study the average height of American women, the heights, in inches, of 200 randomly chosen American women were obtained. This data is located on Problem 1 sheet of your Final Exam Excel workbook. Please answer the following: (32 points total) (a) Draw a “nice” histogram that gives a good representation of the data (use your friend Megastat). (4 points) (b) Find the following descriptive statistics from the data: sample mean, standard deviation, median, maximum, minimum, 1st quartile, and 3rd quartile. Make an intelligent statement about the data using the values of the 1st and 3rd quartiles. (6 points) (c) Use the data to find a 95% confidence interval for , the average height of American women. You should write a probability statement (i.e. P (???) ??? ) using the confidence interval and also an English sentence explaining the meaning of the confidence interval. Clearly indicate if you are finding a z-interval or a t-interval and why you are doing so. (6 points) (d) The purpose of this study was to determine if the average height of American women has significantly increased from the average height found in a study 15 years ago. That average height was 63 inches. Do the data support the claim that the average height is now greater than 63 inches? To answer this question you should set up the appropriate hypothesis test, indicate which hypothesis is the claim, clearly indicate what test statistic you are using, the p-value of the test, and your conclusions in terms of the claim. (10 points) (e) Draw a picture that illustrates the p-value you found in part (d) above. Clearly indicate what type of curve you are using (i.e. a standard normal curve (z) or a student-t curve with specified degrees of freedom). Also state, in a complete English sentence, the meaning of the p-value for this test. For your graphing pleasure I have included a basic bell-shaped curve. The vertical line is at x 0 . (6 points) Problem II. Suppose the height of American women is normally distributed with mean 63 inches and standard deviation 4 inches. Let the random variable X denote the height of a randomly chosen American woman. You are given a graph of the distribution of X below. Please answer the following: (6 points each - 18 points total) Pledge: (a) Find the probability than an American women is at most 5 feet 6 inches tall. Write this probability in terms of a probability statement using the random variable X (i.e. P (???) ??? ). Illustrate the probability on the graph of the distribution of X . (b) If we wanted to do a study involving the tallest 30% of American women, what would be the minimum height possible for an American women to qualify to be a subject in the study? (c) Now suppose we collect data on 16 randomly chosen American women. Let X be the average height of the women in the sample. What is the probability that this average will be at most 5 feet 6 inches? Compare this probability to the one you computed in part (a) and give an intelligent, intuitive reason why they are different and/or the same. Problem III. On the Problem 3 sheet of your Final Exam Excel workbook you will find data consisting of Math SAT scores from random samples collected from two independent groups. Assume that Group 1’s scores are normal with mean 1 and variance 2 and Group 2’s scores are normal with mean 2 and variance 2 . Please answer the following: (6 points each - 18 points total) (a) Construct a hypothesis test (do NOT use regression here) to determine whether there is a significant difference between the two groups average Math SAT scores. Clearly indicate your hypotheses, what test you are using, the value of the test statistic, the pvalue of the test, and your conclusion. (b) Now set up the hypothesis test as a simple regression problem (let the vector X vector be the "Group 1" membership vector). Draw a scatterplot of the data and on the scatterplot show the mean of each group and the regression line. How does the slope of the regression line relate to the sample means of the data? (c) For the regression in part (b), indicate the hypothesis test regarding the regression you have performed that would be equivalent to the hypothesis test in part (a). Clearly give the value of the test statistic, the p-value of the test, and your conclusion. Problem IV. What factors contribute to the price of energy bars that are promoted to provide endurance and promote muscle power? The article “Energy Bars Unwrapped” (Consumer Reports, June 2003, 19-21) included the following data on price, calorie content, protein content (in grams), and fat content (in grams) for a sample of 19 energy bars. This data is on the Problem 4 sheet of your Final Exam Excel workbook. Please answer the following: (33 points total) (a) At the 0.05 level determine the predictive efficiency of the independent variables “Calorie” content, “Protein” content, and “Fat” content on the dependent variable Pledge: “Price.” Clearly indicate your hypotheses, what test statistic you are using to test the hypothesis, the value of the test statistic (and any associated d.o.f.), the p -value of the test, and your conclusion(s). (7 points) (b) Let Fat be the value of the coefficient of the independent variable “Fat” for the population multiple regression equation (using the same variables as in part (a)). Perform the hypothesis test below at the 0.05 level of significance. Be sure to give the value of your test statistic (also state if it is a z , t , F , etc. test statistic), the p -value of the test, and your conclusion(s). (4 points) Hypothesis Test: H 0 : Fat 0 , H a : Fat 0 (c) Determine the coefficients of separate determination for the independent variables in the regression in part (a). Complete the table below: (4 points) Variable Name Calories Protein Fat Value of r 2 CSD (d) Which independent variable(s) have a significant independent effect at the 0.05 level for the regression in part (a)? Why? (2 points) (e) Which independent variable contributes the most to the explained variance of the regression in part(a)? Why? (2 points) (f) Which independent variable is most correlated with the dependent variable? Please give the value of this correlation coefficient. (2 points) (g) Perform a “reduced” regression using the variable “Protein” as the independent variable and “Price” as the dependent variable. What is the value of r 2 for the reduced model? (2 points) (h) Use the appropriate F -test to compare the predictive efficiency of the full model in part (a) to the reduced model in part (g). Clearly indicate the value of your F -test statistic, the d.o.f. of the numerator and denominator, the p -value of the test, and your conclusion(s). (5 points) (i) Suppose an energy bar has 205 calories, 15 grams of protein, and 6.3 grams of fat. Use both regression models (part (a) and part (i)) to find the expected price for this energy bar. Clearly show how you make these computations and clearly indicate which answer is which. (4 points)


