Solution Thermodynamics Problem Set
advertisement
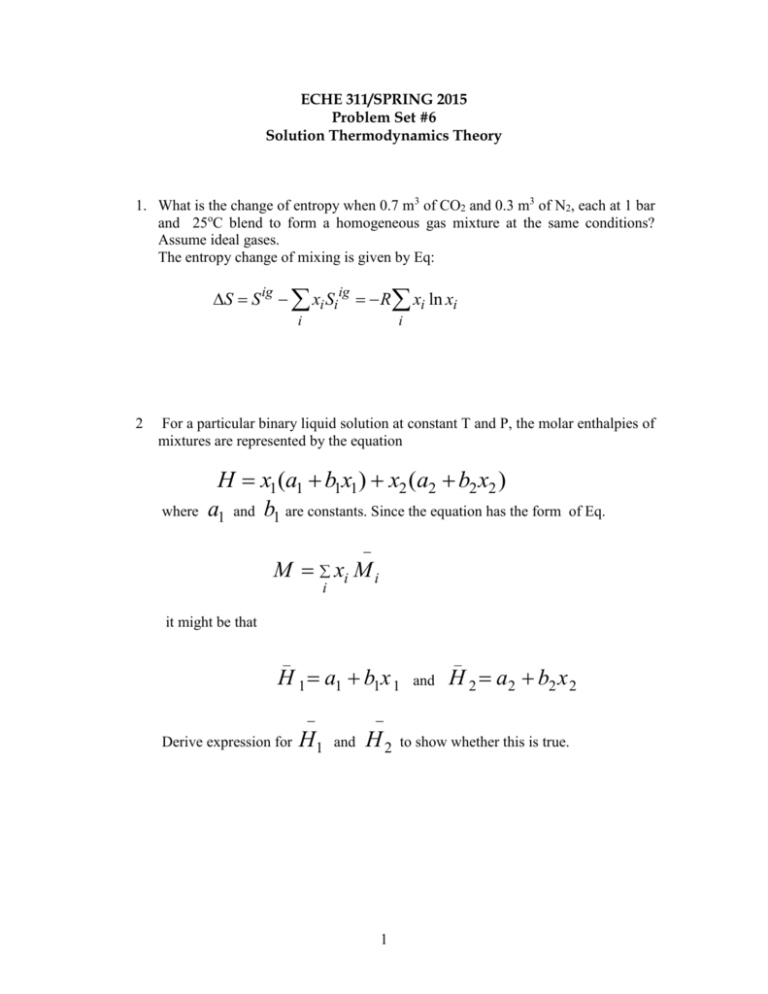
ECHE 311/SPRING 2015 Problem Set #6 Solution Thermodynamics Theory 1. What is the change of entropy when 0.7 m3 of CO2 and 0.3 m3 of N2, each at 1 bar and 25oC blend to form a homogeneous gas mixture at the same conditions? Assume ideal gases. The entropy change of mixing is given by Eq: S S ig xi Si ig R xi ln xi i 2 i For a particular binary liquid solution at constant T and P, the molar enthalpies of mixtures are represented by the equation where H x1 (a1 b1x1 ) x2 (a2 b2 x2 ) a1 and b1 are constants. Since the equation has the form of Eq. M xi M i i it might be that _ H 1 a1 b1 x 1 H1 and H 2 a2 b2 x 2 Derive expression for _ and H2 1 to show whether this is true. 3 From the data of steam tables, determine an estimate for f / f water at 150oC and 150 bar, where f 150oC. Hint: Use Table F.1 150 oC and Eq: ln 4 sat sat for liquid is the fugacity of saturated liquid at V l ( P Pisat ) i f sat RT fi Steam at 9,000 kPa and 400oC undergoes an isothermal change of state to a pressure of 300 kPa. Determine the ratio of the fugacity in the final state to that in the initial state. Hint: Use Table F.2, 9000 kPa & 400oC and get the values of H1 and S1. Use Table F.2, 300 kPa & 400oC and get the values of H2 and S2 The equation 1 H i H i* ln [ ( S i S i* ] may be recast for * R T fi this problem. fi 5 From the following compressibility-factor data for CO2 at 150oC prepare plots of the fugacity and fugacity coefficient of CO2 vs P for pressures up to 500 bar. Compare the resulting curves with those found from the generalized correlation represented by Eq: exp[ Pr o ( B B1 ) Tr __________________________________________________ P/bar Z P/bar Z ___________________________________________________ 10 0.985 100 0.869 20 0.970 200 0.765 40 0.942 300 0.762 60 0.913 400 0.824 80 0.885 500 0.910 _________________________________________________ 2 6 For SO2 at 600oK and 300 bar, determine good estimates of the fugacity and of G/RT. Hint: For given conditions the Lee/Kesler correlation is appropriate. Use data from Tables E.15 & E.16. and Eq. ( o )( 1 ) . 3
