Computing Liquid-Vapor Phase Diagrams ©
by
Sidney H. Young
Department of Chemistry
University of South Alabama
Mobile AL 36688
© Copyright Sidney H Young 1996. All rights reserved.
You are welcome to use this document in your own classes but
commercial use is not allowed without the permission of the author.
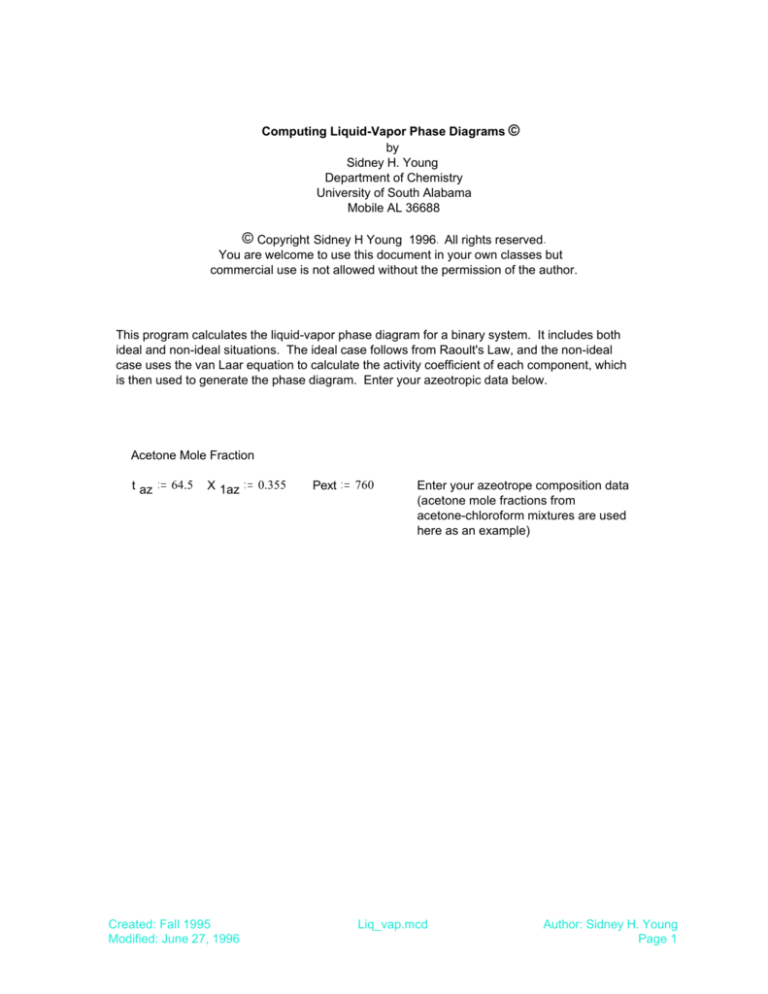
This program calculates the liquid-vapor phase diagram for a binary system. It includes both
ideal and non-ideal situations. The ideal case follows from Raoult's Law, and the non-ideal
case uses the van Laar equation to calculate the activity coefficient of each component, which
is then used to generate the phase diagram. Enter your azeotropic data below.
Acetone Mole Fraction
t az
64.5
X 1az
Created: Fall 1995
Modified: June 27, 1996
0.355
Pext
760
Enter your azeotrope composition data
(acetone mole fractions from
acetone-chloroform mixtures are used
here as an example)
Liq_vap.mcd
Author: Sidney H. Young
Page 1
A. Ideal case
For the ideal case, the Antoine equation gives vapor pressure as a function of temperature
for pure components. It has the form log P=A-b/(t+C), where A, B, and C are constants
depending upon the component, and t is the temperature in Celcius.
We shall use acetone as component 1 and chloroform as component 2. The data come from
Boubik, Fried, and Hala, The Vapor Pressures of Pure Substances, Elsevier, 1973.
The temperature range for the ideal liquid-vapor phase diagram goes from the lower to the higher
boiling point of the components; the boiling points are calculated from the Antoine equation where
P=1atm at the boiling point.
A1
7.11714
A2
6.95465
B1
1210.595
B2
1170.966
C1
229.664
C2
226.252
B1
BP1
A1
log ( Pext )
C1
BP1 = 56.101
P 10
i
10
ti
t
i
B1
C1
Created: Fall 1995
Modified: June 27, 1996
56.1
( 0.2 . i )
C2
log ( Pext )
Predicted and experimental
boiling points
(Exp, BP2=61.7)
0 .. 50
A1
A2
BP2 = 61.184
(Exp, BP1=56.2)
i
B2
BP2
Now step through a series of temperatures
between the two boiling points and compute the
vapor pressure of each component at each point.
A2
P 20
i
Liq_vap.mcd
10
t
i
B2
C2
Author: Sidney H. Young
Page 2
Then the predicted mole fractions at each temperature may be obtained from Raoult's Law,
in which P=X1*P10 + X2*P20
Use X for mole fraction of acetone in the liquid phase and Y for mole fraction of acetone in the
vapor phase.
760
Xi
P 20
i
P 10
i
P 20
i
Yi
Xi . P 10
i
760
IDEAL LIQUID-VAPOR PHASE DIAGRAM
64
62
Temp
60
58
56
0
0.2
0.4
0.6
0.8
1
liquid
vapor
Mole fraction
Created: Fall 1995
Modified: June 27, 1996
Liq_vap.mcd
Author: Sidney H. Young
Page 3
B. NON-IDEAL CASE
Here we must use the experimental azeotropic point to determine the properties of the phase
diagram. The method was proposed by van Laar and modified by Hala (Liquid-Vapor
Equilibirum, Pergamon Press, 1967). The van Laar constants, defined below, are evaluated at
the azeotrope and are used to determine the activity coefficients at all other points of the phase
diagram. Using these activity coefficients, one can calculate the predicted values of Xi and Yi
for all points.
For the chloroform acetone mixture, the azeotrope is found to be at Xi=0.3505, T=64.50 C.
A1
P 10az
10
B1
C1
A2
t az
P 20az
10
B2
C2
t az
P 20az = 845.823
3
P 10az = 1.004 10
These are the partial pressures that the pure substances would have at the azeotrope if
they acted as ideal gases. The activity coefficients at the azeotrope are thus
γ1 az
Pext
P 10az
γ1 az = 0.757
γ2 az
Pext
P 20az
γ2 az = 0.899
Using the van Laar equation, one can calculate the van Laar constants for this system.
X 2az
Av1
log γ1 az . 1
1
X 2az. log γ2 az
X 1az. log γ1 az
X 1az
2
Bv1
log γ2 az . 1
X 1az. log γ1 az
X 2az. log γ2 az
2
Av1 = 0.349
Bv1 = 0.275
Created: Fall 1995
Modified: June 27, 1996
Liq_vap.mcd
Author: Sidney H. Young
Page 4
The van Laar constants are now used to determine the activity coefficients at each mole fraction.
The process so far is that the azeotrope composition allowed the determination of the van Laar
constants and now that we have the van Laar constants we can determine the activity
coefficients for all other compositions.
i
j
0 .. 20
XNi
i
20
k
0 .. 19
1 .. 20
Av1
1
γ1j
γ120
10
XN .Av1
j
1 XN .Bv1
j
1
Bv1
2
1
1
γ2k
γ20
10
. Bv1 2
k
XN . Av1
k
XN
1
To complete the phase diagram, we must find the temperatures at which a solution
of mole fraction X1 will boil.
This calculation is performed by using the temperature-dependent values of the
partial pressures from the Antoine equation and the activity coefficients from the
van Laar equation.
At the boiling point, the sum of the partial pressures must equal the external pressure.
Created: Fall 1995
Modified: June 27, 1996
Liq_vap.mcd
Author: Sidney H. Young
Page 5
MATHCAD uses a function in which an initial guess is made, and a Leavenberg-Marquardt
algorithm modifies the guess, minimizing the difference on either side of the = sign.
As an initial guess, try 54.9 C., which is slightly below the boiling points of either
of the two species.
tn
54.9
Beginning of the sove block.
Given
A1
10
tn
B1
C1
A2
. XN. γ1
10
Temp ( XN , γ1 , γ2 )
tn
tn
Temp ( XN , γ1 , γ2 )
B2
C2
.( 1
XN ) . γ2 Pext
Find( tn )
End of the solve block.
This is a vector of the temperatures corresponding to
the liquid mole fraction vector XN. Type tn= in the space
to the right to see all of the components of the vector.
YN is a vector containing the vapor-phase mole fractions. It is found directly
from Dalton;s Law of Partial Pressures.
A1
γ1i . XNi . 10
YNi
A1
γ1i . XNi . 10
tn
i
B1
C1
tni
B1
C1
A2
γ2i . 1
XNi . 10
tn
i
B2
C2
Type YN= in the space to the fight to see
all of the components of vector YN.
Created: Fall 1995
Modified: June 27, 1996
Liq_vap.mcd
Author: Sidney H. Young
Page 6
NON-IDEAL LIQUID-VAPOR PHASE DIAGRAM
68
66
64
62
tn
i
60
tn
i
Temp
58
56
54
52
0
0.2
0.4
0.6
0.8
1
XN , YN
i
i
liquid
vapor
Mole Fraction
Created: Fall 1995
Modified: June 27, 1996
Liq_vap.mcd
Author: Sidney H. Young
Page 7
Now plot activity coefficients as a function of mole fraction.
Activity Coefficients
1
0.9
0.8
γ 1i
γ 2i
0.7
0.6
0.5
0.4
0
0.2
0.4
0.6
XN
Created: Fall 1995
Modified: June 27, 1996
0.8
1
i
Liq_vap.mcd
Author: Sidney H. Young
Page 8


