Long-term effectiveness of diet-plus-exercise interventions vs. diet
advertisement
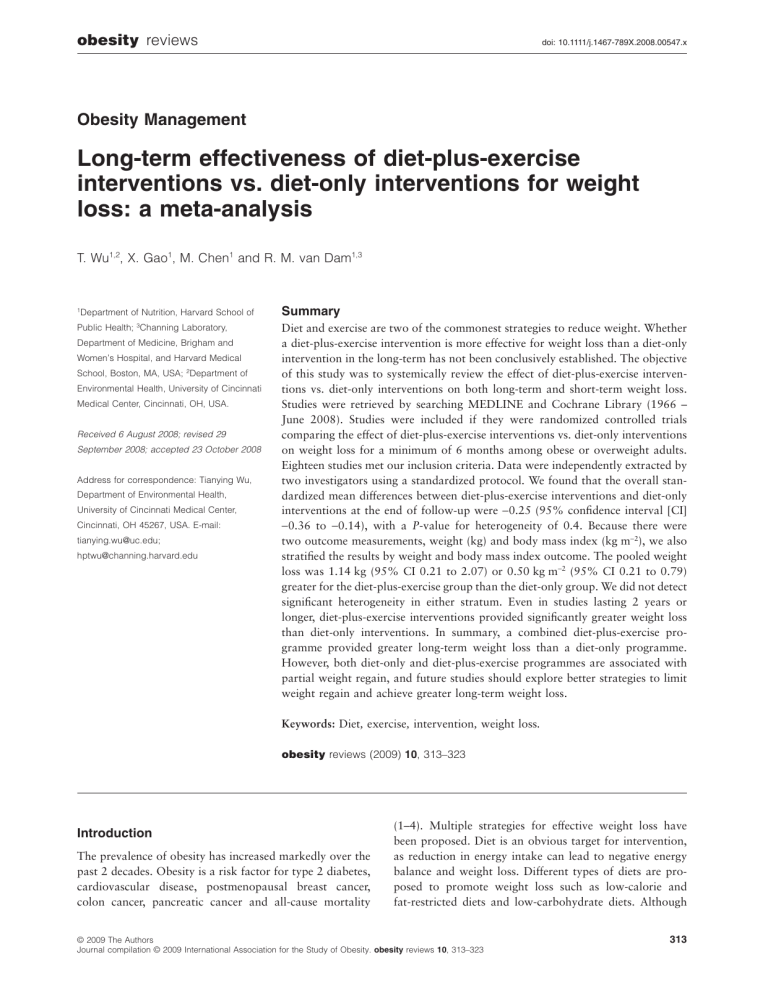
obesity reviews doi: 10.1111/j.1467-789X.2008.00547.x Obesity Management Long-term effectiveness of diet-plus-exercise interventions vs. diet-only interventions for weight loss: a meta-analysis T. Wu1,2, X. Gao1, M. Chen1 and R. M. van Dam1,3 1 Summary Public Health; 3Channing Laboratory, Diet and exercise are two of the commonest strategies to reduce weight. Whether a diet-plus-exercise intervention is more effective for weight loss than a diet-only intervention in the long-term has not been conclusively established. The objective of this study was to systemically review the effect of diet-plus-exercise interventions vs. diet-only interventions on both long-term and short-term weight loss. Studies were retrieved by searching MEDLINE and Cochrane Library (1966 – June 2008). Studies were included if they were randomized controlled trials comparing the effect of diet-plus-exercise interventions vs. diet-only interventions on weight loss for a minimum of 6 months among obese or overweight adults. Eighteen studies met our inclusion criteria. Data were independently extracted by two investigators using a standardized protocol. We found that the overall standardized mean differences between diet-plus-exercise interventions and diet-only interventions at the end of follow-up were -0.25 (95% confidence interval [CI] -0.36 to -0.14), with a P-value for heterogeneity of 0.4. Because there were two outcome measurements, weight (kg) and body mass index (kg m-2), we also stratified the results by weight and body mass index outcome. The pooled weight loss was 1.14 kg (95% CI 0.21 to 2.07) or 0.50 kg m-2 (95% CI 0.21 to 0.79) greater for the diet-plus-exercise group than the diet-only group. We did not detect significant heterogeneity in either stratum. Even in studies lasting 2 years or longer, diet-plus-exercise interventions provided significantly greater weight loss than diet-only interventions. In summary, a combined diet-plus-exercise programme provided greater long-term weight loss than a diet-only programme. However, both diet-only and diet-plus-exercise programmes are associated with partial weight regain, and future studies should explore better strategies to limit weight regain and achieve greater long-term weight loss. Department of Nutrition, Harvard School of Department of Medicine, Brigham and Women’s Hospital, and Harvard Medical School, Boston, MA, USA; 2Department of Environmental Health, University of Cincinnati Medical Center, Cincinnati, OH, USA. Received 6 August 2008; revised 29 September 2008; accepted 23 October 2008 Address for correspondence: Tianying Wu, Department of Environmental Health, University of Cincinnati Medical Center, Cincinnati, OH 45267, USA. E-mail: tianying.wu@uc.edu; hptwu@channing.harvard.edu Keywords: Diet, exercise, intervention, weight loss. obesity reviews (2009) 10, 313–323 Introduction The prevalence of obesity has increased markedly over the past 2 decades. Obesity is a risk factor for type 2 diabetes, cardiovascular disease, postmenopausal breast cancer, colon cancer, pancreatic cancer and all-cause mortality (1–4). Multiple strategies for effective weight loss have been proposed. Diet is an obvious target for intervention, as reduction in energy intake can lead to negative energy balance and weight loss. Different types of diets are proposed to promote weight loss such as low-calorie and fat-restricted diets and low-carbohydrate diets. Although © 2009 The Authors Journal compilation © 2009 International Association for the Study of Obesity. obesity reviews 10, 313–323 313 314 Diet-plus-exercise intervention compared with diet-only intervention on weight loss findings from dietary intervention studies suggest that a low-carbohydrate dietary pattern may be most effective in inducing weight loss in the short term, there is no conclusive evidence that one diet is superior to another in the long term (5). Physical activity is another target for weight loss interventions, because energy expenditure is largely influenced by physical activity. If people lose weight through dietary restriction, their energy expenditure is reduced: eating less reduces diet-related thermogenesis, loss of body mass reduces both resting energy expenditure and the amount of energy required for specific activities, and adaptive suppression of thermogenesis may occur (6). This reduction in energy expenditure makes it more difficult to achieve long-term weight loss. Physical activity increases energy expenditure, both directly and through increased metabolic rate (van Baak, 1999 p. 107) and may therefore compensate for the reduction in energy expenditure resulting from diet-induced weight loss. Hence, one would expect that combining dietary restriction with increased physical activity facilitates successful long-term weight loss. For many years, numerous small studies have focused on the effect of different levels of exercise in obese individuals; however, few reviews have directly compared the effect of diet-plus-exercise (D + E) intervention with a diet-only (D) intervention on weight loss. Whether D + E intervention is more effective for weight loss than D intervention has not been conclusively established. Meta-analysis may be especially useful in summarizing and analysing prior research when the number of subjects per individual study is small. Previous meta-analyses by Curioni et al. and Miller et al. (7,8) focused on interventions over a short time period (1 year or less), and more information on effects on long-term weight loss is needed. We therefore evaluated the effect of D + E interventions vs. D interventions on long-term weight loss using meta-analysis. Methods Study selection Studies were eligible for inclusion in our review if they were randomized controlled trials, compared a D + E intervention with a D intervention that was administered simultaneously and with the dietary programme being identical in both intervention groups, had a study duration (intervention time plus follow-up time after intervention) of at least 6 months, reported weight and/or body mass index (BMI) before and after the intervention, and were conducted in adults. Dietary interventions included any type of weight loss diet including low-carbohydrate diets and energyrestricted diets. Exercise interventions included any type of exercise programme. We only included articles published in English-language journals. We conducted a comprehensive literature search of Medline (Pubmed) and Cochrane T. Wu et al. obesity reviews Library from 1966 to 30 June 2007. We used the keywords: ‘diet’, ‘exercise’, ‘physical activity’ and ‘physical exertion’, and the Medical Subject Headings: ‘diet therapy’, ‘physical fitness’, ‘exercise’, ‘exertion’ and ‘exercise movement techniques’ in combination with the keywords: ‘weight’, ‘weight loss’, ‘obesity’ and ‘body mass index’, and the Medical Subject Headings: ‘BMI’, ‘body weight changes’ and ‘body mass index’. Additional studies were found via the reference lists of the identified articles. The selection process for studies included in our review is shown in Fig. 1. Our search strategy and exclusion criteria resulted in a total of 18 articles being included in the meta-analysis (9–26). Of these, 10 articles examined weight loss for less than 1 year, 11 for 1–1.9 years, seven for ⱖ2 years and seven for 6 years (seven studies reported results for more than one time point). Data extraction Using a standardized data extraction form, two independent investigators extracted and tabulated all data (T. W. and M. C.). Discrepancies were resolved by group discussions. The data we collected included the last author’s name, year of publication, country of origin, sample size, mean age and BMI, gender, duration of the intervention and the follow-up after intervention, type of dietary and exercise intervention and other relevant characteristics of the study population. We extracted baseline and postintervention means and standard deviations for weight measurements including weight (kg) and BMI (kg m-2). Statistical analysis The primary outcome was change in body weight. The effect size for each study was the difference in weight loss between the two intervention groups (the D + E group and the D group). A random effects model was used to pool the results from the individual studies which allows for both sampling error and additional between-study heterogeneity (27). There were two main measures of weight in these studies: weight (kg) or BMI (kg m-2). Because these two measures are on a different scale, we first calculated the standardized mean differences for each study and then pooled the standardized mean differences. Standardized mean differences were obtained using Cohen’s d method by dividing the change in body weight by the standard deviation of the change in body weight as expressed in weight or BMI (28). As a result, the standardized mean differences are mean differences on a standard deviation scale and do not have a measurement unit. We also pooled studies separately for weight (kg) and BMI (kg m-2) without using Cohen’s method. For some studies, there were different D + E groups because different types of exercise programmes were assigned: we pooled the results of these D + E groups together, weighted by inverse of the variance within each © 2009 The Authors Journal compilation © 2009 International Association for the Study of Obesity. obesity reviews 10, 313–323 obesity reviews Diet-plus-exercise intervention compared with diet-only intervention on weight loss T. Wu et al. 315 Flow diagram for the selection of studies Medline 806 Review of reference lists 10 Cochrane library 766 Exclude Non-human studies (14 studies) Age < 19 (249 studies) No-English articles (36 studies) Redundant publications, no diet or diet plus exercise group, no weight measurement, total intervention and follow-up time <6 months (631) 63 studies Exclude Repeated publications for the same studies (28 studies) Dietary intervention in the diet group differing from that in the diet plus exercise group; physical activity and dietary intervention not being administered simultaneously (15) Participants were cancer patients (1) Cross-over study (1) Figure 1 Full text review for 63 studies. group. As a secondary analysis, we also examined the effects of interventions on percentage of body fat loss. Using the last time point of weight loss measurement for each study, we also performed a meta-analysis among subgroups by baseline age, BMI, gender, the length of the intervention and the subsequent follow-up without active intervention and comorbidities (as defined by diabetes, cardiovascular risk factors such as elevated LDL-C and impaired glucose tolerance and metabolic syndrome). The P-values for differences in effects between strata were obtained using univariate meta-regression (29). To determine the presence of publication bias, we assessed the symmetry of the funnel plots in which mean differences were plotted against their corresponding standard errors, and we used Begg and Egger test for detecting publication bias (30). We further conducted sensitivity analysis by excluding those studies with higher dropout rate (more than 20% in both intervention groups) or the dropout rate between two intervention groups was more than 10% different. All analyses were conducted using STATA 8.2 (StataCorp, College Station, TX, USA); two-sided P-values <0.05 were considered statistically significant. Results The baseline characteristics for the studies included in the meta-analysis are presented in Table 1. The mean age of the Final 18 studies study population ranged from 36 to 55 years. The mean weight ranged from 70 to 100 kg and the mean BMI from 25 to 38 kg m-2. Ten studies included both men and women, and three included only women (11,21,22), four included only men (13,15,18,23). As a result of our eligibility criteria, the total duration of the study (the duration of active intervention plus subsequent follow-up after intervention) was at least 6 months in all studies. The length of intervention varied from 3 months to 6 years, and the length of the subsequent follow-up without active intervention varied from 0 to 2.5 years. With regard to randomized intervention studies, there are general criteria for evaluating the quality of clinical trials including randomization procedures, allocation concealment, blinding of outcome measurement, dropout rate and intent-to-treat analysis. However, most of the studies in our meta-analysis failed to mentioned whether they adhered to these rules or conducted the studies according to these guidelines. Only three studies stated their randomization procedures (12,16,20), none of the studies mentioned allocation concealment, one study mentioned that they did have blinding of outcome measurement (12), and only two studies had a 0% dropout rate (12,13), in which intent-totreat analysis was conducted; the rest of the studies did not conduct intent-to-treat analyses. Table 2 shows weight loss at the end of follow-up for the D + E groups and D groups for individual studies and for © 2009 The Authors Journal compilation © 2009 International Association for the Study of Obesity. obesity reviews 10, 313–323 USA Norway USA China Anderssen et al. (1996) (9) Skender et al. (1996) (19) Pan et al. (1997) (17) Denmark Svendsen et al. (1993) (21) Williams et al. (1994) (23) USA Leighton et al. (1990) (16) Sweden USA Wing et al. (1988) (24) Hellenius et al. (1993) (13) Country Reference M&F 44 35 40 37 46 54 42.5 55.5 Mean age 25.9 35 29 30.5 25.6 30 27 38 Mean BMI (kg m-2) Supervised weekly in a group, aerobic (walking, jogging), reached 60–80% maximum heart rate, 30–40 min, 2–3 time per week NCEP step 1 diet† 6 years Supervised weekly although group, brisk walking at a level of felt ‘vigorous’ not ‘strenuous’, 45 min, 4–5 times per week Increased the amount of exercise at least 1 U d-1¶ and 2 U d-1 for those less than 50 years old with no evidence of heart or arthritis. The rate of increase and type of exercise depending on age, past exercise pattern and existence of heart problem other than impaired glucose tolerance. Physical activity was followed up every 3 months HYHEP diet§ (low-energy eating plan) Calorie intake at 25–30 kcal kg-1 (105–126 kJ kg-1), 55–65% carbohydrate, 10–15% protein and 25–30% of fat. Increased vegetable intake and reduced intake of sugars; using individual goals 12 months Supervised weekly, aerobic training (strength, flexibility, circuit training, jogging), reached 60–80% of peak heart rate 12 months 12 months 6 months 3 months 6.5 months 14.5 months Duration of the active intervention Increased fish, fruit and vegetables and fibre, reduced intake of sugar and saturated fatty acids, no heavy evening meals Aerobic exercise (brisk walking and jogging), 25–45 min, reached 60–80% of the maximal heart rate, three times per week Supervised three times per week in a group. Combination of aerobic (bicycling, stair walking and treadmill) plus anaerobic exercise (resistance weight training), for a total of 1.0–1.5 h, reaching 70% of maximal oxygen consumption 4200 KJ d-1, included obligatory diet supplement (NUPO)** plus foods NCEP step 1 diet Supervised weekly in a group. Aerobic exercise (stationary bicycling, walking, jogging, stair climbing or rowing), reached 55% of aerobic capacity for the first 10 weeks and 75% of maximal aerobic capacity after week 10 Supervised weekly in a group, walked 3 miles each time, four times per week Exercise programme NCEP initial diet* Calorie-restricted diet (1000 calorie deficit) Dietary intervention 0 12 months 0 0 0 6 months 0 0 Follow-up after intervention Subjects with impaired glucose tolerance including diabetes Obese subjects Sedentary subjects Obese men Healthy men with moderate cardiovascular risk Healthy postmenopausal women Subjects with elevated LDL-C levels Type 2 diabetics Population T. Wu et al. 155 M&F M&F M M F M&F M&F Sex Diet-plus-exercise intervention compared with diet-only intervention on weight loss 36 177 76 79 100 66 28 n Table 1 Characteristics of the trials included in the meta-analysis 316 obesity reviews © 2009 The Authors Journal compilation © 2009 International Association for the Study of Obesity. obesity reviews 10, 313–323 Country USA USA USA Finland Norway USA Sweden Reference Wadden et al. (1998) (22) Wing et al. (1998) (25) Stefanick et al. (1998) (20) Fogelholm et al. (2000) (11) Reseland et al. (2001) (18) Kiernan et al. (2001) (14) Brekke et al. (2005) (10) Table 1 Continued © 2009 The Authors Journal compilation © 2009 International Association for the Study of Obesity. obesity reviews 10, 313–323 49 152 101 82 97 77 77 n M&F M&F M F M&F M&F F Sex 43 35 46 35 50.5 45.5 42 Mean age 25.5 30 for men 28 for women 27 34 26.6 36 36.5 Mean BMI (kg m-2) Supervised weekly, aerobic exercise = 16 km jogging per week NCEP step 2 diet‡ Nordic nutrition recommendation*** plus low-glycemic index foods NCEP step 1 diet Increased intakes of fish, vegetables and fibre; reduced intakes of saturated fat and cholesterol Low-fat diet Increased physical activity (walking or other activity), ⱖ30 min, 4–5 times per week. Supervised intervention was through group discussions. Intensive follow-up was conducted in the first 4 months by a 72-h physical activity recall every 10 d; less intensive follow-up was performed after 4 months (recall every 10 weeks) Supervised programme of aerobic exercise (brisk walking and jogging), three times per week, reached 60–80% of maximal heart rate for 25–45 min per time (by the fourth month) Supervised weekly in group. Aerobic, circuit training, fast walking and jogging, 60 min, three times per week Supervised weekly in a group, reached 50–60% of maximal heart rate, included two groups: (1) walking, expended 4.2 MJ per week; and (2) walking, expend 8.4 MJ per week 24 months Supervised by exercise physiologists weekly in a group. Mainly brisk walking, 3 miles, five times per week, total activity gradually increased to 1500 kcal per week Low-calorie and low-fat regimen with 20% of calorie plus fat at 800–1000 kcal d-1 during week 1–8 and gradually adjusted to 1200– 1500 kcal d-1 after week 16 12 months 12 months 12 months 13 months 12 months 12 months Supervised weekly in a group, 1 h, two times per week, included three exercise groups: (1) Aerobic, expended 300–400 kcal per time; (2) strength, expended 150–176 kcal per time; (3) combined (aerobic + strength), 40% aerobic, expended 225–275 kcal per time Conventional diet with 1200–1500 kcal d-1 Duration of the active intervention Exercise programme Dietary intervention 12 months 0 0 11 months 0 0 13 months Follow-up after intervention First degree relatives of type II diabetes Overweight subjects Men with the metabolic syndrome Premenopausal women Men and postmenopausal women with low HDL-C and high LDL-C Non-diabetic subjects with parental history of diabetes Obese women Population obesity reviews Diet-plus-exercise intervention compared with diet-only intervention on weight loss T. Wu et al. 317 USA Messier et al. (2004) (26) 158 36 90 n M&F M&F F Sex 69 37.5 42 Mean age 34.5 27.5 33 Mean BMI (kg m-2) The goal of intervention was to produce and maintain an average weight loss of 5% baseline body weight. The intervention was divided into three phases: intensive (months 1–4), transition (months 5–6) and maintenance (months 7–18) 25% calorie restriction diet based on American Heart association recommendations (ⱕ30% fat) Two months of very low-energy diet (2 MJ d-1) followed by low-energy diet (5 MJ d-1) Dietary intervention The exercise programme consisted of an aerobic phase, a resistance-training phase, a second aerobic phase and cooling down phase 18 months 6 months 8 months Included walking and resistance training, 45 min, three times per week, reached 60–70% of oxygen consumption, expended 1.7 MJ in walking and 1.2 MJ in resistance each time. Participants were supervised weekly during weight reduction and maintenance phase before the intervention Supervised weekly in a group, increased 12.5% energy expenditure (walking, running, cycling) 5 d per week Duration of the active intervention Exercise programme 0 0 23 months Follow-up after intervention Overweight and obese individuals with knee osteoarthritis Overweight adults Obese men Population Diet-plus-exercise intervention compared with diet-only intervention on weight loss *NCEP initial diet: less than 30% of energy from total fat, <10% of energy from saturated fat and <300 mg of cholesterol per day. † NCEP step 1 diet: less than 30% of energy from total fat, <10% of energy from saturated fat, >10% of energy from polyunsaturated fat, up to 10–15% of energy from monounsaturated fat, 50–60% of energy from carbohydrate, 10–20% of energy from protein and <200 mg of cholesterol per day. ‡ NCEP step 2 diet: less than 30% of energy from total fat, <7% of energy from saturated fat and <200 mg of cholesterol per day. § HYHEP diet: help your heart eating plan. A low-cholesterol eating plan with energy intake of 30% from fat, 50% from carbohydrate and 20% from protein. ¶1 U: equals to 30 min of slow walking or shopping. **NUPO: supplied protein 65 g, carbohydrate 21 g, dietary fibres 30 g, fat 5 g and calcium and phosphorous 800 mg d-1. ***Nordic Nutrition recommendations: 10% of energy from saturated fat, increase intake of monounsaturated fat and n-3 fatty acids, 50–60% of energy from carbohydrate and 10–20% from protein, <300 mg of cholesterol per day. BMI, body mass index; F, female; HDL-C, high-density lipoprotein cholesterol; LDL-C, low-density lipoprotein cholesterol; M, male; NCEP, national cholesterol education programme. USA Finland Kukkonen-Harjula et al. (2005) (15) Heilbronn et al. (2006) (12) Country Reference Table 1 Continued 318 T. Wu et al. obesity reviews © 2009 The Authors Journal compilation © 2009 International Association for the Study of Obesity. obesity reviews 10, 313–323 © 2009 The Authors Journal compilation © 2009 International Association for the Study of Obesity. obesity reviews 10, 313–323 6 6.5 9 12 14.5 24 24 24 24 25 18 6 12 12 12 12 31 72 6 12 12 12 12 8 72 Total duration* 6 6.5 3 12 14.5 12 24 13 12 12 18 Intervention (months) † *Total duration, intervention time plus follow-up time after intervention. Average dropout rate if not specially indicated. ‡ D denotes diet-only group. § D + E denotes diet-plus-exercise group. Two measurements for weight were recorded, weight (kg) or BMI (kg m-2). BMI, body mass index; CI, confidence interval. Weight (kg) Heilbronn et al. (2006) (12) Leighton et al. (1990) (16) Svendsen et al. (1993) (21) Kiernan et al. (2001) (14) Wing et al. (1988) (24) Skender et al. (1996) (19) Wing et al. (1998) (25) Fogelholm et al. (2000) (11) Brekke et al. (2005) (10) Wadden et al. (1998) (22) Messier et al. (2004) (26) Pooled mean 95% CI (kg) BMI (kg m-2) Hellenius (1993) Williams et al. (1994) (23) Anderssen et al. (1996) (9) Stefanick et al. (1998) (20) Reseland et al. (2001) (18) Kukkonen-Harjula et al. (2005) (15) Pan et al. (1997) (17) Pooled mean 95% CI (kg m-2) Study 8% in D + E and D -1.60 -1.83 -2.45 to -1.21 -0.60 -2.80 -2.16 -3.10 -1.80 -0.87 0% in D + E and 0% in 14% in D + E and 13% 3% in D + E and 5% in 3% in D + E and 1% in 0% in D + E and 0% in 23% in D + E and 26% D in D D D D in D -8.00 -2.00 1.40 -8.70 -7.90 -2.20 -2.50 -7.50 -1.90 -9.10 -5.20 -3.60 -6.74 to -0.46 D+E 0% in D + E§ and 0% in D‡ 27% in D + E and 18% in D 2% in D + E and 2% in D 10% in D + E and 18% in D 13% in D + E and 0% in D 50% in D + E and 65% in D 20% in D + E and 5% in D 2% in D + E and 3% in D 17% in D + E and 4% in D 22% in D + E and D 24% in D + E and 23% in D dropout rate† Table 2 Weight loss differences between diet-plus-exercise group and diet-only group at the end of follow-up -1.10 -1.38 -1.92 to -0.84 -0.30 -1.50 -1.63 -2.70 -1.30 -1.80 -8.00 0 1.50 –5.00 -3.80 0.90 -2.10 9.70 -0.08 -6.90 -4.61 -1.78 -4.86 to 1.30 D -0.50 -0.50 -0.79 to -0.21 -0.30 -1.30 -0.53 -0.40 -0.50 0.93 0 -2.00 -0.1 -3.70 -4.10 -3.10 -0.40 -2.20 -1.82 -2.20 -0.59 -1.14 -2.07 to -0.21 Differences obesity reviews Diet-plus-exercise intervention compared with diet-only intervention on weight loss T. Wu et al. 319 320 Diet-plus-exercise intervention compared with diet-only intervention on weight loss Study (reference) obesity reviews Standardized mean differences (95% CI) Wing 1988 (25) –0.72 (–1.49,0.05) Leighton 1990 (17) –0.14 (–0.70,0.41) Svendsen 1993 (22) –0.03 (–0.43,0.36) Hellenius 1993 (14) –0.30 (–0.74,0.14) Williams 1994 (24) –0.74 (–1.21,–0.28) Anderssen 1996 (10) –0.30 (–0.66,0.07) Skender 1996 (20) –0.43 (–1.11,0.24) Pan 1997 (18) –0.28 (–0.59,0.04) Stefanick 1998 (21) –0.11 (–0.53,0.30) Wing 1998 (26) –0.05 (–0.53,0.43) Wadden 1998 (23) –0.28 (–0.90,0.35) Fogelholm 2000 (12) –0.20 (–0.75,0.35) Kiernan 2001 (15) –0.64 (–1.10,–0.19) Reseland 2001(19) –0.36 (–0.76,0.04) Messier 2004 (27) –0.03 (–0.34,0.28) Brekke 2005 (11) –0.45 (–1.02,0.12) Kukkonen 2005 (16) 0.31 (–0.28,0.89) Heilbronn 2006 (13) 0.00 (–0.69,0.69) Overall (95% CI) –0.25 (–0.36,–0.14) -1 T. Wu et al. 0 1 Weight loss differences between the two groups P (for heterogeneity) = 0.4 Figure 2 Pooled standardized mean differences of weight loss between diet-plus-exercise and diet-only groups at the end of study. CI, confidence interval. all studies combined. Ten studies reported results as change in weight (kg) and seven studies as change in BMI (kg m-2). After pooling the data, weight loss was 3.34 kg or 0.87 kg m-2 in D + E group and 1.38 kg or 1.48 kg m-2 in the D group. The pooled weight loss was 1.24 kg (95% confidence interval [CI] 0.23 to 2.26) or 0.50 kg m-2 (95% CI 0.21 to 0.79) greater for D + E group as compared with D group. We did not detect significant heterogeneity in results for either the studies reporting weight change (P-value for heterogeneity = 0.2) or the studies reporting change in BMI (P-value for heterogeneity = 0.3). In two studies, the interventions were initiated after an intensive weight loss intervention in the weight maintenance phase and did not lead to further weight loss (11,15). The dropout rates for the interventions were lower than 30% (Table 2), except for the study by Skender et al. which had a 50–65% dropout rate (19). The dropout rate in the D + E group was similar to that in the D group in most of the studies. In a sensitivity analysis excluding those with higher dropout rate or highly different dropout rates in two groups, the overall results did not change. We also pooled the results on weight and BMI separately using the time frame at 1–2 and after 2 years. For the 1–2 year time point, the weighted mean difference between D + E and D groups was -2.29 kg for weight (kg) (95% CI -3.52 to -1.06, P for heterogeneity = 0.8; from seven studies) and -0.67 kg m-2 for BMI (kg m-2) (95% CI -1.05 to -0.30, P for heterogeneity0 = 0.4; from four studies). For the time frame after 2 years, the differences between the two groups was -1.78 kg for weight (kg) (95% CI -3.43 to -0.13, P for heterogeneity = 0.9; from five studies) and -0.04 kg m-2 for BMI (kg m-2) (95% CI -1.35 to 1.27, P for heterogeneity = 0.1; from two studies). To be able to combine the studies reporting weight change and BMI change, we also expressed results as standardized mean differences between the intervention groups. Using the measurement at the end of each study (Fig. 2), the pooled standardized mean difference between D + E and D groups was -0.25 (95% CI -0.36 to -0.14), with a P-value for heterogeneity of 0.4 (pooled standardized mean difference was expressed as mean or standard deviation, thus it does not have a unit). We also calculated standardized pooled mean differences at different time points. The pooled standardized difference was -0.14 (95% CI -0.30 to 0.03; 10 studies; P for heterogeneity = 0.9), <1.0 year; -0.32 (95% CI -0.44 to -0.17; 10 studies; P for heteroge- © 2009 The Authors Journal compilation © 2009 International Association for the Study of Obesity. obesity reviews 10, 313–323 obesity reviews Diet-plus-exercise intervention compared with diet-only intervention on weight loss T. Wu et al. 321 Table 3 Pooled standardized mean differences according to study characteristics (using the last point of measurement) Group Mean differences* 95% CI No of studies Between-group heterogeneity P-value for differences between strata All studies Age category <45 years ⱖ45 years Overweight category BMI ⱖ 30 kg m-2 BMI < 30 kg m-2 Sex Male Female Mixed Intervention time ⱖ1 year <1 year Follow-up time after active intervention 0 month >0 month -0.25 (-0.36 to -0.14) 18 -0.32 -0.21 (-0.48 to -0.16) (-0.39 to -0.02) 11 7 0.30 -0.29 -0.27 (-0.56 to -0.02) (-0.41 to -0.13) 8 10 0.90 -0.31 -0.13 -0.29 (-0.68 to -0.07) (-0.41 to 0.16) (-0.44 to -0.14) 4 3 11 0.30 -0.35 -0.07 (-0.48 to -0.22) (-0.29 to 0.16) 13 5 0.03 -0.32 -0.15 (-0.46 to -0.19) (-0.37 to 0.07) 12 6 0.20 *Mean differences are standardized mean differences expressed per standard deviation (without unit). CI, confidence interval. neity = 0.3), after 1.0–1.9 years; and -0.20 (95% CI -0.39 to -0.02; seven studies; P for heterogeneity = 0.5), after 2.0 or more years. In the trial of Pan et al. (17), clinics instead of individuals were randomized to different interventions. We therefore performed a sensitivity analysis excluding this trial and observed a similar pooled difference in weight loss between D + E intervention and D intervention. As a secondary analysis, we examined effects of interventions on percentage of body fat mass loss based on the six studies for which data on body fatness were reported (11,16,18,21–23). Consistent with our primary analysis, we found that the percentage of body fat loss at the end of the study was greater for the combined D + E intervention as compared with the D intervention (pooled difference 2%; 95% CI 0.65% to 3.5%). Table 3 shows the results of subgroup analyses. The difference in weight loss between the D + E and the D group was significantly greater in studies with a longer intervention period (P = 0.03). Meta-regression did not show statistical significant differences in results by baseline age, obesity, sex, population, comorbidities and duration of follow-up after the active intervention no matter whether they were entered as continuous or categorical variables. The funnel plot (graph not shown) showed data points symmetrically scattered across the horizontal line indicating a lack of association between study precision and the effects size (i.e. standardized mean differences in weight change between the D + E and D groups). The Begg (P = 0.7) and Egger (P = 0.9) tests also did not provide evidence for publication bias. Discussion In this meta-analysis of 18 randomized trials, we found that interventions including a combined D + E programme produced greater long-term weight loss than interventions that only included a diet programme. This difference in weight loss was significantly greater for interventions with a duration longer than 1 year than that for interventions of shorter duration. In general, achieving long-term weight loss is difficult. Previous meta-analyses included trials with a maximum of 1-year follow-up (7,8); our analysis included seven trials with a duration of 2 years or longer. The achievement after 2 years may appear small, averaging 1.64 kg or 1.24 kg m-2 loss of body weight after a combination of dietary changes and increased physical activity. There may be several reasons for this modest long-term effect. First, poor compliance is often an issue in long-term intervention studies. Other researchers reported that the degree of adherence to weight loss interventions is a strong predictor of weight loss (31,32). Second, we found that intervention time was significantly associated with greater weight loss associated with adding exercise to the intervention programme which is in line with some previous studies (33,34). Our study thus suggests that a prolonged active intervention may be important; this could be accomplished in several ways: by regular clinical visits, at group meetings or through encouragement by telephone or emails. In fact, one study reached 5.6% (1.6 kg m-2) decrease in BMI after 6 years (17) suggesting that substantial long-term weight © 2009 The Authors Journal compilation © 2009 International Association for the Study of Obesity. obesity reviews 10, 313–323 322 Diet-plus-exercise intervention compared with diet-only intervention on weight loss loss is achievable. It has been reported that 5% loss of body weight is associated with a marked decrease in incidence of type 2 diabetes and other metabolic disturbances (33,34). It should be noted that including exercise in interventions improves various health-related parameters independent of effects on body fatness including blood lipid profile, blood pressure, insulin sensitivity and psychological wellbeing (14). Our meta-analysis had several strengths. Meta-analysis provides more precise estimates than individual studies and allows evaluation of potential determinants of heterogeneity in results. We conducted an extensive literature search to retrieve all relevant eligible trials resulting in 18 randomized clinical trials including seven trials with a duration of 2 years or longer. A previous meta-analysis (7,8,35,36) did not include any intervention study longer than 2 years. Anderson et al. (37) conducted a metaanalysis on long-term maintenance of weight loss for up to 5 years; however, their results were from observational studies, which lack randomization and are thus prone to confounding. A number of limitations of the present analysis should also be acknowledged. First, heterogeneity in results may be introduced by differences between trials, including different D + E regimens. However, heterogeneity test using random effect model was not significant. Further, heterogeneity in the amount of additional weight loss associated with adding exercise to the intervention programme appeared to be limited. Our pooled results therefore suggest that D + E intervention is generally more beneficial for long-term weight loss than D intervention, independent of the D regimen and type of exercise used in the included studies. Publication bias cannot be excluded to affect the results on any meta-analysis; however, formal statistical testing did not suggest publication bias for the current analysis. Finally, most studies did not provide information on the quality of the intervention such as randomization method, allocation concealment and blinding of the study assignments to the persons performing the outcome measurements. Although many studies included in our analysis had a substantial dropout rate (see Table 2), intent-to-treat analyses were generally not conducted. However, dropouts were less likely to bias the comparison of the weight loss for D + E intervention as compared with D intervention because dropout rates were generally similar for these intervention groups. Our sensitivity analysis showed that exclusion of studies with high dropout rates or dropout rates that were substantially different for the D + E group and D group did not change the overall results. Future studies on long-term weight loss should clearly report the randomization method, allocation concealment, blinding and the use of intent-to-treat analysis. In conclusion, the present study confirms the importance of including exercise in addition to diet in long-term weight T. Wu et al. obesity reviews loss programmes. A combined D + E programme provided greater weight loss even in studies lasting 2 years or longer. However, both D and D + E programmes are associated with partial long-term weight regain, and future studies should explore better strategies to limit weight regain and achieve greater long-term weight loss. Conflict of Interest Statement No conflict of interest was declared. References 1. Koh-Banerjee P, Wang Y, Hu FB, Spiegelman D, Willett WC, Rimm EB. Changes in body weight and body fat distribution as risk factors for clinical diabetes in US men. Am J Epidemiol 2004; 159: 1150–1159. 2. Giovannucci E, Michaud D. The role of obesity and related metabolic disturbances in cancers of the colon, prostate, and pancreas. Gastroenterology 2007; 132: 2208–2225. 3. Huang Z, Hankinson SE, Colditz GA, Stampfer MJ, Hunter DJ, Manson JE, Hennekens CH, Rosner B, Speizer FE, Willett WC. Dual effects of weight and weight gain on breast cancer risk. JAMA 1997; 278: 1407–1411. 4. van Dam RM, Willett WC, Manson JE, Hu FB. The relationship between overweight in adolescence and premature death in women. Ann Intern Med 2006; 145: 91–97. 5. Malik V, Hu FB. Popular weight-loss diets: from evidence to practice. [WWW document]. URL http://www.nature.com/ clinicalpractice/cardio (accessed June 2006). 6. Dulloo AG. Suppressed thermogenesis as a cause for resistance to slimming and obesity rebound: adaptation or illusion? Int J Obes (2005) 2007; 31: 201–203. 7. Curioni CC, Lourenco PM. Long-term weight loss after diet and exercise: a systematic review. Int J Obes (Lond) 2005; 29: 1168–1174. 8. Miller WC, Koceja DM, Hamilton EJ. A meta-analysis of the past 25 years of weight loss research using diet, exercise or diet plus exercise intervention. Int J Obes Relat Metab Disord 1997; 21: 941–947. 9. Anderssen SA, Hjermann I, Urdal P, Torjesen PA, Holme I. Improved carbohydrate metabolism after physical training and dietary intervention in individuals with the ‘atherothrombogenic syndrome’. Oslo Diet and Exercise Study (ODES). A randomized trial. J Intern Med 1996; 240: 203–209. 10. Brekke HK, Jansson PA, Lenner RA. Long-term (1- and 2-year) effects of lifestyle intervention in type 2 diabetes relatives. Diabetes Res Clin Pract 2005; 70: 225–234. 11. Fogelholm M, Kukkonen-Harjula K, Nenonen A, Pasanen M. Effects of walking training on weight maintenance after a verylow-energy diet in premenopausal obese women: a randomized controlled trial. Arch Intern Med 2000; 160: 2177–2184. 12. Heilbronn LK, de Jonge L, Frisard MI, DeLany JP, LarsonMeyer DE, Rood J, Nguyen T, Martin CK, Volaufova J, Most MM, Greenway FL, Smith SR, Deutsch WA, Williamson DA, Ravussin E, Pennington CALERIE Team. Effect of 6-month calorie restriction on biomarkers of longevity, metabolic adaptation, and oxidative stress in overweight individuals: a randomized controlled trial. JAMA 2006; 295: 1539–1548. 13. Hellenius ML, de Faire U, Berglund B, Hamsten A, Krakau I. Diet and exercise are equally effective in reducing risk for cardio- © 2009 The Authors Journal compilation © 2009 International Association for the Study of Obesity. obesity reviews 10, 313–323 obesity reviews Diet-plus-exercise intervention compared with diet-only intervention on weight loss vascular disease. Results of a randomized controlled study in men with slightly to moderately raised cardiovascular risk factors. Atherosclerosis 1993; 103: 81–91. 14. Kiernan M, King AC, Stefanick ML, Killen JD. Men gain additional psychological benefits by adding exercise to a weightloss program. Obes Res 2001; 9: 770–777. 15. Kukkonen-Harjula KT, Borg PT, Nenonen AM, Fogelholm MG. Effects of a weight maintenance program with or without exercise on the metabolic syndrome: a randomized trial in obese men. Prev Med 2005; 41: 784–790. 16. Leighton RF, Repka FJ, Birk TJ, Lynch DJ, Bingle JF, Gohara AF, Saffran J, Weaver MT, Brewster PM, Walsh ME. The Toledo exercise and diet study. Results at 26 weeks. Arch Intern Med 1990; 150: 1016–1020. 17. Pan XR, Li GW, Hu YH, Wang JX, Yang WY, An ZX, Hu ZX, Lin J, Xiao JZ, Cao HB, Liu PA, Jiang XG, Jiang YY, Wang JP, Zheng H, Zhang H, Bennett PH, Howard BV. The Da Qing IGT and diabetes study. Diabetes Care 1997; 20: 537–544. 18. Reseland JE, Anderssen SA, Solvoll K, Hjermann I, Urdal P, Holme I, Drevon CA. Effect of long-term changes in diet and exercise on plasma leptin concentrations. Am J Clin Nutr 2001; 73: 240–245. 19. Skender ML, Goodrick GK, Del Junco DJ, Reeves RS, Darnell L, Gotto AM, Foreyt JP. Comparison of 2-year weight loss trends in behavioral treatments of obesity: diet, exercise, and combination interventions. J Am Diet Assoc 1996; 96: 342–346. 20. Stefanick ML, Mackey S, Sheehan M, Ellsworth N, Haskell WL, Wood PD. Effects of diet and exercise in men and postmenopausal women with low levels of HDL cholesterol and high levels of LDL cholesterol. N Engl J Med 1998; 339: 12–20. 21. Svendsen OL, Hassager C, Christiansen C. Effect of an energyrestrictive diet, with or without exercise, on lean tissue mass, resting metabolic rate, cardiovascular risk factors, and bone in overweight postmenopausal women. Am J Med 1993; 95: 131– 140. 22. Wadden TA, Vogt RA, Foster GD, Anderson DA. Exercise and the maintenance of weight loss: 1-year follow-up of a controlled clinical trial. J Consult Clin Psychol 1998; 66: 429–433. 23. Williams PT, Krauss RM, Stefanick ML, Vranizan KM, Wood PD. Effects of low-fat diet, calorie restriction, and running on lipoprotein subfraction concentrations in moderately overweight men. Metabolism 1994; 43: 655–663. 24. Wing RR, Epstein LH, Paternostro-Bayles M, Kriska A, Nowalk MP, Gooding W. Exercise in a behavioural weight control T. Wu et al. 323 programme for obese patients with Type 2 (non-insulindependent) diabetes. Diabetologia 1988; 31: 902–909. 25. Wing RR, Venditti E, Jakicic JM, Polley BA, Lang W. Lifestyle intervention in overweight individuals with a family history of diabetes. Diabetes Care 1998; 21: 350–359. 26. Messier SP, Loeser RF, Miller GD, Morgan TM, Rejeski WJ, Sevick MA, Ettinger WH, Williamson Jr., Pahor, MJD. Exercise and dietary weight loss in overweight and obese older adults with knee osteoarthritis: the Arthritis, Diet, and Activity Promotion Trial. Arthritis Rheum 2004; 50: 1501–1510. 27. DerSimonian R, Laird N. Meta-analysis in clinical trials. Control Clin Trials 1986; 7: 177–188. 28. Rosenthal R. Parametric measures of effect size. In: Copper H, Hedges L (eds). The Hand Book of Research Synthesis. Russell Stage Foundation: New York, 1994. 29. Thompson SG. Why and how sources of heterogeneity should be investigated. In: Egger M, Smith GD, Altman DG (eds). Systematic Reviews in Health Care: Meta-Analysis in Context. BMJ Publishing Group: London, 2001. 30. Egger M, Altman D, Smith G (eds). Systematic Reviews in Health Care: Meta-analysis in Context. BMI Books: London, 2001. 31. Dansinger ML, Gleason JA, Griffith JL, Selker HP, Schaefer EJ. Comparison of the Atkins, Ornish, Weight Watchers, and Zone diets for weight loss and heart disease risk reduction: a randomized trial. JAMA 2005; 293: 43–53. 32. Heshka S, Anderson JW, Atkinson RL, Greenway FL, Hill JO, Phinney SD, Kolotkin RL, Miller-Kovach K, Pi-Sunyer FX. Weight loss with self-help compared with a structured commercial program: a randomized trial. JAMA 2003; 289: 1792–1798. 33. Perri MG, Nezu AM, Patti ET, McCann KL. Effect of length of treatment on weight loss. J Consult Clin Psychol 1989; 57: 450–452. 34. Foster GD, Makris AP, Bailer BA. Behavioral treatment of obesity. Am J Clin Nutr 2005; 82: 230S–5S. 35. Wing RR. Physical activity in the treatment of the adulthood overweight and obesity: current evidence and research issues. Med Sci Sports Exerc 1999; 31: S547–S552. 36. Ross R, Janssen I. Physical activity, total and regional obesity: dose-response considerations. Med Sci Sports Exerc 2001; 33: S521–S527 37. Anderson JW, Konz EC, Frederich RC, Wood CL. Long-term weight-loss maintenance: a meta-analysis of US studies. Am J Clin Nutr 2001; 74: 579–584. © 2009 The Authors Journal compilation © 2009 International Association for the Study of Obesity. obesity reviews 10, 313–323
