INVESCO VAN KAMPEN
Enhanced Index Strategies Portfolio 2010-4
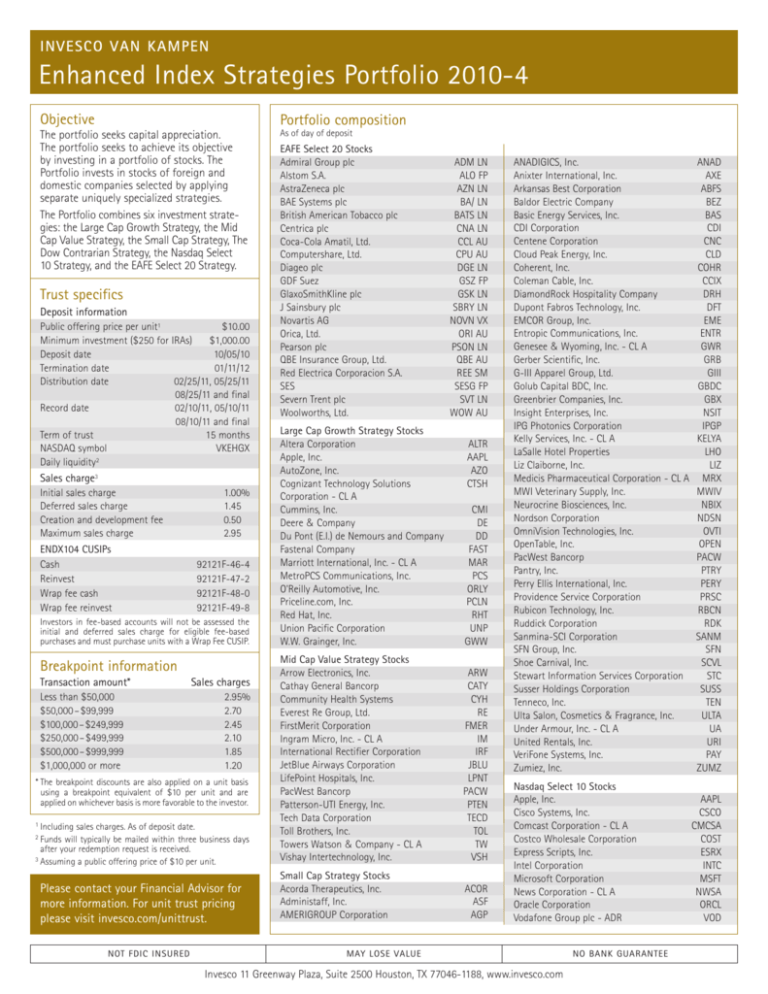
Objective
Portfolio composition
The portfolio seeks capital appreciation.
The portfolio seeks to achieve its objective
by investing in a portfolio of stocks. The
Portfolio invests in stocks of foreign and
domestic companies selected by applying
separate uniquely specialized strategies.
The Portfolio combines six investment strategies: the Large Cap Growth Strategy, the Mid
Cap Value Strategy, the Small Cap Strategy, The
Dow Contrarian Strategy, the Nasdaq Select
10 Strategy, and the EAFE Select 20 Strategy.
As of day of deposit
Trust specifics
Deposit information
Public offering price per unit1
$10.00
Minimum investment ($250 for IRAs)
$1,000.00
Deposit date
10/05/10
Termination date
01/11/12
Distribution date
02/25/11, 05/25/11
08/25/11 and final
Record date
02/10/11, 05/10/11
08/10/11 and final
Term of trust
15 months
NASDAQ symbol
VKEHGX
Daily liquidity2
Sales charge3
Initial sales charge
Deferred sales charge
Creation and development fee
Maximum sales charge
ENDX104 CUSIPs
Cash
Reinvest
Wrap fee cash
Wrap fee reinvest
1.00%
1.45
0.50
2.95
92121F-46-4
92121F-47-2
92121F-48-0
92121F-49-8
Investors in fee-based accounts will not be assessed the
initial and deferred sales charge for eligible fee-based
purchases and must purchase units with a Wrap Fee CUSIP.
Breakpoint information
Transaction amount*
Less than $50,000
$50,000–$99,999
$100,000–$249,999
$250,000–$499,999
$500,000–$999,999
$1,000,000 or more
Sales charges
2.95%
2.70
2.45
2.10
1.85
1.20
* The breakpoint discounts are also applied on a unit basis
using a breakpoint equivalent of $10 per unit and are
applied on whichever basis is more favorable to the investor.
1
Including sales charges. As of deposit date.
Funds will typically be mailed within three business days
after your redemption request is received.
3 Assuming a public offering price of $10 per unit.
2
Please contact your Financial Advisor for
more information. For unit trust pricing
please visit invesco.com/unittrust.
NOT FDIC INSURED
EAFE Select 20 Stocks
Admiral Group plc
Alstom S.A.
AstraZeneca plc
BAE Systems plc
British American Tobacco plc
Centrica plc
Coca-Cola Amatil, Ltd.
Computershare, Ltd.
Diageo plc
GDF Suez
GlaxoSmithKline plc
J Sainsbury plc
Novartis AG
Orica, Ltd.
Pearson plc
QBE Insurance Group, Ltd.
Red Electrica Corporacion S.A.
SES
Severn Trent plc
Woolworths, Ltd.
ADM LN
ALO FP
AZN LN
BA/ LN
BATS LN
CNA LN
CCL AU
CPU AU
DGE LN
GSZ FP
GSK LN
SBRY LN
NOVN VX
ORI AU
PSON LN
QBE AU
REE SM
SESG FP
SVT LN
WOW AU
Large Cap Growth Strategy Stocks
Altera Corporation
Apple, Inc.
AutoZone, Inc.
Cognizant Technology Solutions
Corporation - CL A
Cummins, Inc.
Deere & Company
Du Pont (E.I.) de Nemours and Company
Fastenal Company
Marriott International, Inc. - CL A
MetroPCS Communications, Inc.
O'Reilly Automotive, Inc.
Priceline.com, Inc.
Red Hat, Inc.
Union Pacific Corporation
W.W. Grainger, Inc.
CMI
DE
DD
FAST
MAR
PCS
ORLY
PCLN
RHT
UNP
GWW
Mid Cap Value Strategy Stocks
Arrow Electronics, Inc.
Cathay General Bancorp
Community Health Systems
Everest Re Group, Ltd.
FirstMerit Corporation
Ingram Micro, Inc. - CL A
International Rectifier Corporation
JetBlue Airways Corporation
LifePoint Hospitals, Inc.
PacWest Bancorp
Patterson-UTI Energy, Inc.
Tech Data Corporation
Toll Brothers, Inc.
Towers Watson & Company - CL A
Vishay Intertechnology, Inc.
ARW
CATY
CYH
RE
FMER
IM
IRF
JBLU
LPNT
PACW
PTEN
TECD
TOL
TW
VSH
Small Cap Strategy Stocks
Acorda Therapeutics, Inc.
Administaff, Inc.
AMERIGROUP Corporation
ACOR
ASF
AGP
ALTR
AAPL
AZO
CTSH
ANADIGICS, Inc.
Anixter International, Inc.
Arkansas Best Corporation
Baldor Electric Company
Basic Energy Services, Inc.
CDI Corporation
Centene Corporation
Cloud Peak Energy, Inc.
Coherent, Inc.
Coleman Cable, Inc.
DiamondRock Hospitality Company
Dupont Fabros Technology, Inc.
EMCOR Group, Inc.
Entropic Communications, Inc.
Genesee & Wyoming, Inc. - CL A
Gerber Scientific, Inc.
G-III Apparel Group, Ltd.
Golub Capital BDC, Inc.
Greenbrier Companies, Inc.
Insight Enterprises, Inc.
IPG Photonics Corporation
Kelly Services, Inc. - CL A
LaSalle Hotel Properties
Liz Claiborne, Inc.
Medicis Pharmaceutical Corporation - CL A
MWI Veterinary Supply, Inc.
Neurocrine Biosciences, Inc.
Nordson Corporation
OmniVision Technologies, Inc.
OpenTable, Inc.
PacWest Bancorp
Pantry, Inc.
Perry Ellis International, Inc.
Providence Service Corporation
Rubicon Technology, Inc.
Ruddick Corporation
Sanmina-SCI Corporation
SFN Group, Inc.
Shoe Carnival, Inc.
Stewart Information Services Corporation
Susser Holdings Corporation
Tenneco, Inc.
Ulta Salon, Cosmetics & Fragrance, Inc.
Under Armour, Inc. - CL A
United Rentals, Inc.
VeriFone Systems, Inc.
Zumiez, Inc.
Nasdaq Select 10 Stocks
Apple, Inc.
Cisco Systems, Inc.
Comcast Corporation - CL A
Costco Wholesale Corporation
Express Scripts, Inc.
Intel Corporation
Microsoft Corporation
News Corporation - CL A
Oracle Corporation
Vodafone Group plc - ADR
MAY LOSE VALUE
Invesco 11 Greenway Plaza, Suite 2500 Houston, TX 77046-1188, www.invesco.com
NO BANK GUARANTEE
ANAD
AXE
ABFS
BEZ
BAS
CDI
CNC
CLD
COHR
CCIX
DRH
DFT
EME
ENTR
GWR
GRB
GIII
GBDC
GBX
NSIT
IPGP
KELYA
LHO
LIZ
MRX
MWIV
NBIX
NDSN
OVTI
OPEN
PACW
PTRY
PERY
PRSC
RBCN
RDK
SANM
SFN
SCVL
STC
SUSS
TEN
ULTA
UA
URI
PAY
ZUMZ
AAPL
CSCO
CMCSA
COST
ESRX
INTC
MSFT
NWSA
ORCL
VOD
Portfolio composition - continued
As of day of deposit
Morningstar Equity Style BoxTM
As of the business day before deposit date
Large value 14.59%
Large blend 20.88%
Large growth 21.74%
Mid value 4.58%
Mid blend 5.88%
Mid growth 8.33%
Small value 12.31%
Small blend 5.91%
Small growth 5.78%
The trust portfolio is provided for informational purposes
only and should not be deemed as a recommendation to
buy or sell the individual securities shown above. Invesco
Van Kampen unit investment trusts are distributed by the
sponsor, Van Kampen Funds Inc., and broker dealers including Invesco Distributors, Inc. Both firms are wholly owned,
indirect subsidiaries of Invesco Ltd.
Small Cap Strategy5
Outlined below is the selection process for each of the six
different strategies that are combined to create the Enhanced
Index Strategies Portfolio.
Small Cap Growth Component
1. Eliminate stocks from the Russell 2000 Index with share prices of less than $5.
2. Rank remaining stocks by Earnings Pressure.SM
3. Select the 25 stocks with the highest Earnings Pressure.SM
In addition, a stock will be excluded and such stock will be replaced
with the stock with the next highest Earnings Pressure if, based on
publicly available information as of the selection date, the company is
the target of an announced business acquisition which Invesco expects
will close within six months of the date of deposit.
The Dow Contrarian Strategy
Select the 10 stocks from the Dow Jones Industrial Average with the
lowest percentage price change over the preceding 52-week period.
Large Cap Growth Strategy
1. Eliminate stocks from the S&P 500 Index with share prices of less than $5.
2. The remaining stocks are ranked by price momentum and the 75 stocks
with the highest price momentum are selected. (A comparison of
current stock price versus historical stock prices).
3. Rank these 75 stocks by Earnings PressureSM 4, a proprietary measure
developed by Lightstone Capital Management.
4. The strategy selects the 15 stocks with the highest Earnings Pressure,
provided that no more than six stocks may be selected from any single
industry (as defined by Zacks Investment Research), no more than two
stocks may have a market capitalization of less than $5 billion dollars
and provided that the stock of any affiliate of Invesco or any of its
affiliates, will be excluded and replaced with the stock with the next
highest Earnings Pressure.
In addition, a stock will be excluded and such stock will be replaced
with the stock with the next highest Earnings Pressure if, based on
publicly available information as of the selection date, the company
is the target of an announced business acquisition which Invesco
expects will close within six months of the date of deposit.
Small Cap Value Component
1. Eliminate stocks from the Russell 2000 Index with share prices of less than $5.
2. Rank remaining stocks in index by price-to-sales ratio (PSR).
3. Select 200 stocks with the lowest PSR. (A low PSR may help dampen
the risks associated with a pure-growth strategy).
4. Select the 25 stocks with the highest Earnings Pressure.SM
In addition, a stock will be excluded and such stock will be replaced
with the stock with the next highest Earnings Pressure if, based on
publicly available information as of the selection date, the company is
the target of an announced business acquisition which Invesco expects
will close within six months of the date of deposit.
EAFE Select 20 Strategy
1. Apply quality screens to the MSCI EAFE Index6 to include only those
companies with positive one- and three-year sales and earnings
growth and three years of positive dividend growth.
2. Select stocks with the highest market capitalization (the top 75%).
3. Select the 20 stocks with the highest dividend yields.
Mid Cap Value Strategy
1. Begin with the Standard & Poor’s MidCap 400 Index.
2. Screen out all stocks with a share price under $5.
3. Take the 100 stocks with the lowest price/book ratio.
4. Select the 15 stocks with the highest Earnings Pressure.SM In addition,
a stock will be excluded and such stock will be replaced with the stock
with the next highest Earnings Pressure if, based on publicly available
information as of the selection date, the company is the target of
an announced business acquisition which Invesco expects will close
within six months of the date of deposit.
Nasdaq Select 10 Strategy
1. Select the 20 largest market capitalization stocks in the Nasdaq-100 Index.
2. From these 20, select the 10 stocks with the highest annual dollar sales
as of the most recently reported 12-month period.
BLEND GROWTH
LARGE
Consumer discretionary 13.27%
Consumer staples 6.85%
Energy 3.43%
Financials 11.52%
Health care 10.45%
Industrials 15.02%
Information technology 29.74%
Materials 3.58%
Telecommunication services 2.78%
Utilities 3.36%
VALUE
MID
AA
BAC
CSCO
XOM
GE
HPQ
INTC
JNJ
JPM
MSFT
SMALL
The Dow Contrarian Strategy Stocks
Alcoa, Inc.
Bank of America Corporation
Cisco Systems, Inc.
Exxon Mobil Corporation
General Electric Company
Hewlett-Packard Company
Intel Corporation
Johnson & Johnson
JPMorgan Chase & Company
Microsoft Corporation
Sector diversification and
style breakout
Earnings Pressure is a proprietary formula which uses the increase in estimates of future earnings by analysts
that follow each stock. The portfolio consultant calculates Earnings Pressure as follows: (1) Obtain the
Consensus EPS for the next 12-month period for each stock included in the Index from which the stocks are
chosen as of the selection date of the Portfolio. (2) Obtain the Consensus EPS for the end of each of the most
recent three months prior to the selection date of the portfolio and combine them to obtain the average
Consensus EPS over the most recent three months (fixed multipliers are used to increase the weighting of the
more recent Consensus EPS figures). (3) Calculate the relative changes in Consensus EPS over the most recent
three months by subtracting the amount obtained in (2) above from the amount obtained in (1) above (the
Change in Consensus EPS) and the dividing the Change in Consensus EPS). (4) The resulting Relative Change
in Consensus EPS as calculated in (3) above is then divided by the standard deviation amount from the Zacks
database which measures the variation among the individual analyst EPS data. (5) The resulting amount as
calculated in (4) above is then multiplied by the number 1 plus the net number of total upward revisions
minus total downward revisions in individual analyst EPS data during the most recent three month period.
This is Earnings Pressure.
5
In connection with the Strategic Small-Cap Strategy, if one or more stocks are selected by both the growthcomponent and the value-component criteria, it will be counted as one selection only. As a result, to get to a
total of 50 stocks, additional stocks will be identified and selected by alternately applying the growth
component to arrive at another stock and then applying the value component to arrive at another stock,
continuing as necessary to get to 50 stocks. Approximately equal dollar amounts are invested in each stock.
6
The strategy does not include stocks from Singapore, which in the opinion of Invesco may be subject to undue
market volatility and political instability over time. Any stocks which are passive foreign investments companies
are also eliminated from the strategy.
In general the classifications used were based first on market capitalization using the definition: Small-Cap-less
than $1 billion; Mid-Cap-$1 billion to $5 billion, Large-Cap-over $5 billion. Invesco uses Price/Book to determine
the growth and value characteristics. Stocks with high relative price-to-book ratios are considered growth, while
stocks with low relative price-to-book ratios are considered value stocks.
4
Before investing, investors should carefully read the prospectus and consider the investment objectives, risks, charges and expenses. For this and
more complete information about the trust(s), investors should ask their advisers for a prospectus or download one at invesco.com/unittrust.
Risk considerations
There is no assurance the trust will achieve its investment objective. An investment in this unit investment trust is subject to market risk, which is the possibility that
the market values of securities owned by the trust will decline and that the value of trust units may therefore be less than what you paid for them. This trust is
unmanaged and its portfolio is not intended to change during the trust’s life except in limited circumstances. Accordingly, you can lose money investing in this trust.
You should consider this trust as part of a long-term investment strategy and you should consider your ability to pursue it by investing in successive trusts, if
available. You will encounter tax consequences associated with reinvesting from one trust to another.
Investing in foreign securities involves certain risks not typically associated with investing solely in the United States. This may magnify volatility due to changes in
foreign exchange rates, the political and economic uncertainties in foreign countries, and the potential lack of liquidity, government supervision and regulation.
This trust is concentrated in the information technology industry. There are certain risks specific to technology stocks such as volatile stock prices, rapid product
obsolescence, and speculative trading.
Stocks of small companies are often more volatile than those of larger companies as a result of several factors such as limited trading volumes, products or financial
resources, management inexperience and less publicly available information.
The Russell 2000 Index is an unmanaged index generally representative of the U.S. market for small-capitalization stocks.
The Morgan Stanley Capital International Europe, Australasia, and Far East Index (“MSCI EAFE”) is an unmanaged index generally representative of major overseas stock markets.
NASDAQ 100 index represents 100 of the largest non-financial, domestic and international companies traded on the NASAQ Stock Market, Inc. based on market capitalization.
The Standard & Poor’s MidCap 400, introduced in 1991, is now the most widely used index for mid-sized companies. S&P MidCap 400 covers approximately 7% of the U.S. equities market.
The Dow Jones Industrial AverageSM is a product of Dow Jones Indexes, a licensed trademark of CME Group Index Services LLC (“CME”), and has been licensed for use. “Dow Jones®”, “Dow Jones
Industrial AverageSM”, “DJIASM”, and “Dow Jones Indexes” are service marks of Dow Jones Trademark Holdings, LLC (“Dow Jones”) and have been licensed for use for certain purposes by
Invesco and certain trusts. The trusts, based on the Dow Jones Industrial AverageSM, are not sponsored, endorsed, sold or promoted by Dow Jones, CME or their respective affiliates and none of
them makes any representation regarding the advisability of investing in such products(s).
Indices are statistical composites and their returns do not include payment of any sales charges or fees an investor would pay to purchase the securities they represent. Such costs would lower
performance. It is not possible to invest directly in an index.
John B. Lightstone, PhD, and Lightstone Capital Management are the property of John B. Lightstone, PhD, and Lightstone Capital Management, who are not affiliated with Invesco Funds Inc.
Lightstone Capital Management is also being compensated for portfolio consulting services, including selection of the stocks for the trust.
The Nasdaq-100,® Nasdaq-100 Index,® and Nasdaq® are trade or service marks of The Nasdaq Stock Market, Inc. (which with its affiliates are the Corporations) and are licensed for use
by Invesco. The trust has not been passed on by the Corporations as to their legality or suitability. The trust is not issued, endorsed, sold, or promoted by the Corporations. THE CORPORATIONS
MAKE NO WARRANTIES AND BEAR NO LIABILITY WITH RESPECT TO THE TRUST. The trust's selection process is proprietary and is the subject of a United States patent under license to Invesco
and the trust.
The trust is not sponsored, endorsed, or promoted by MSCI Inc., and MSCI Inc. bears no liability with respect to any trust or any index on which the trust is based. The prospectus contains a
more detailed description of the limited relationship MSCI Inc. has with the sponsor and any related trust.
Morningstar Datalab is the source for the style box that appears on the previous page. The Morningstar Equity Style Box™ is based on holdings as of the date of deposit of the trust and may
vary thereafter. The Morningstar Equity Style Box™ placement is based on two variables. First, on a trust’s market capitalization relative to the movements of the market and second, the
valuation by comparing the stocks in the trust’s portfolio with the most relevant of the three market capitalization groups. Source: Morningstar, Inc., Chicago, IL 312-696-6000.
© 2010 Morningstar, Inc. All Rights Reserved. The information contained herein: (1) is proprietary to Morningstar and/or its content providers; (2) may not be copied or distributed; and
(3) is not warranted to be accurate, complete or timely. Neither Morningstar nor its content providers are responsible for any damages or losses arising from any use of this information.
Past performance is no guarantee of future results.
Value, blend and growth are types of investment styles. Growth investing generally seeks stocks that offer the potential for greater-than-average earnings growth, and may entail greater risk
than value or blend investing. Value investing generally seeks stocks that may be sound investments but are temporarily out of favor in the marketplace, and may entail less risk than growth
investing. A blend investment combines the two styles.
www.invesco.com/unittrust
Invesco
11 Greenway Plaza, Suite 2500
Houston, TX 77046-1188
www.invesco.com
Invesco Distributors, Inc.
U-ENDX104-FCT-1 10.10


