Standard Deviation
advertisement

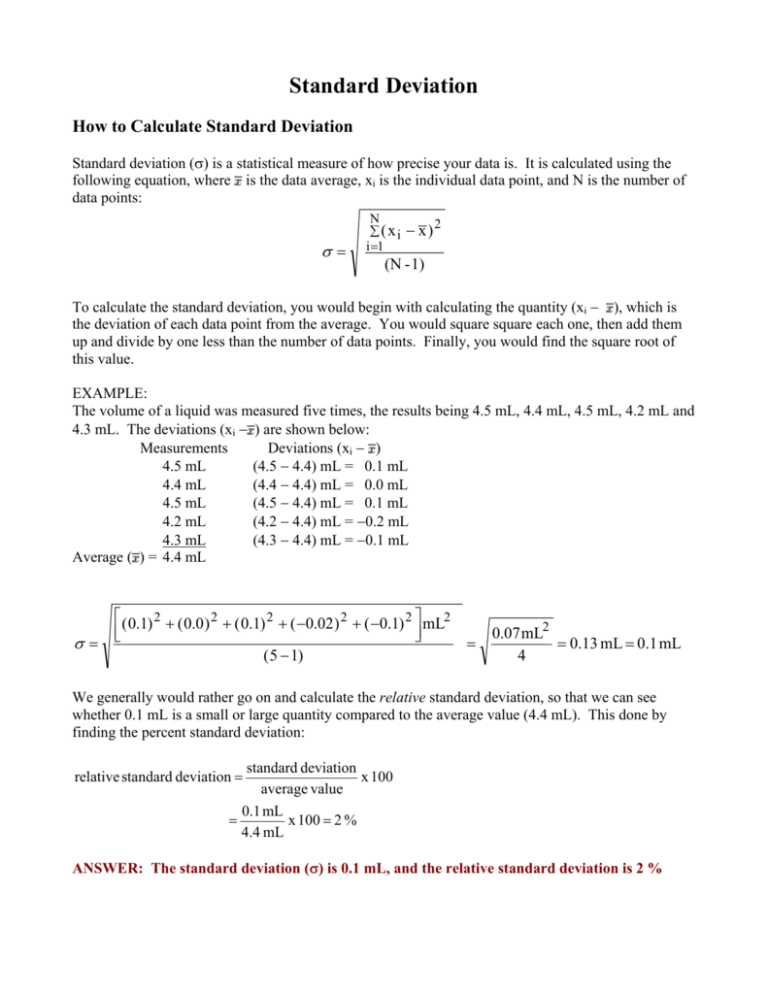
Standard Deviation How to Calculate Standard Deviation Standard deviation (σ) is a statistical measure of how precise your data is. It is calculated using the following equation, where is the data average, xi is the individual data point, and N is the number of data points: σ= N 2 ∑(xi − x) i =1 (N - 1) To calculate the standard deviation, you would begin with calculating the quantity (xi − ), which is the deviation of each data point from the average. You would square square each one, then add them up and divide by one less than the number of data points. Finally, you would find the square root of this value. EXAMPLE: The volume of a liquid was measured five times, the results being 4.5 mL, 4.4 mL, 4.5 mL, 4.2 mL and 4.3 mL. The deviations (xi − ) are shown below: Measurements Deviations (xi − ) 4.5 mL (4.5 − 4.4) mL = 0.1 mL 4.4 mL (4.4 − 4.4) mL = 0.0 mL 4.5 mL (4.5 − 4.4) mL = 0.1 mL 4.2 mL (4.2 − 4.4) mL = −0.2 mL 4.3 mL (4.3 − 4.4) mL = −0.1 mL Average ( ) = 4.4 mL σ= ( 0.1) 2 + ( 0.0 ) 2 + ( 0.1) 2 + ( −0.02 ) 2 + ( −0.1) 2 mL2 ( 5 − 1) = 0.07 mL2 = 0.13 mL = 0.1 mL 4 We generally would rather go on and calculate the relative standard deviation, so that we can see whether 0.1 mL is a small or large quantity compared to the average value (4.4 mL). This done by finding the percent standard deviation: standard deviation x 100 average value 0.1 mL = x 100 = 2 % 4.4 mL relative standard deviation = ANSWER: The standard deviation (σ) is 0.1 mL, and the relative standard deviation is 2 % What Exactly Does Standard Deviation Tell Us? Frequency Inconsistent errors that cannot be attributed to any known cause but are due to unavoidable errors in measurements made by human beings are called indeterminate errors. For a large collection of such data, the measurements would form a bell curve, known as the normal distribution curve, as shown below. The x-axis represents the magnitude of magnitude of error and the y-aixs represents the frequency of error. The correct value should be the one that is most frequently obtained. Value lower than the Correct Value Value higher than the Correct Value Correct Value For such data, which occurs only for large number of samples (N>20), the standard deviation has the following meaning: 68 % of the data would fall within the range of one standard deviation of the average 95% will fall within the range of two standard deviations 99% will be within 2.5 standard deviations. In the example given above, σ = 0.1 mL and the average is 4.4 mL. This means that 68 % of the data is within 4.4 mL ± 0.1 mL (or between 4.3 ml and 4.5 mL). 95 % of the data is within 4.4 mL ± 2(0.1mL) = 4.4 mL ± 0.2 mL (or between 4.2 and 4.6 mL). Frequency of Data Value The smaller the standard deviation, the narrower is the range, which translate to a higher reproducibility. A small standard deviation means the experimental values are clustered together tightly (i.e. a higher precision). -σ +σ - 2σ +2σ mean value Data Value


