Ka Determination of Bromocresol Green: Spectrophotometry
advertisement
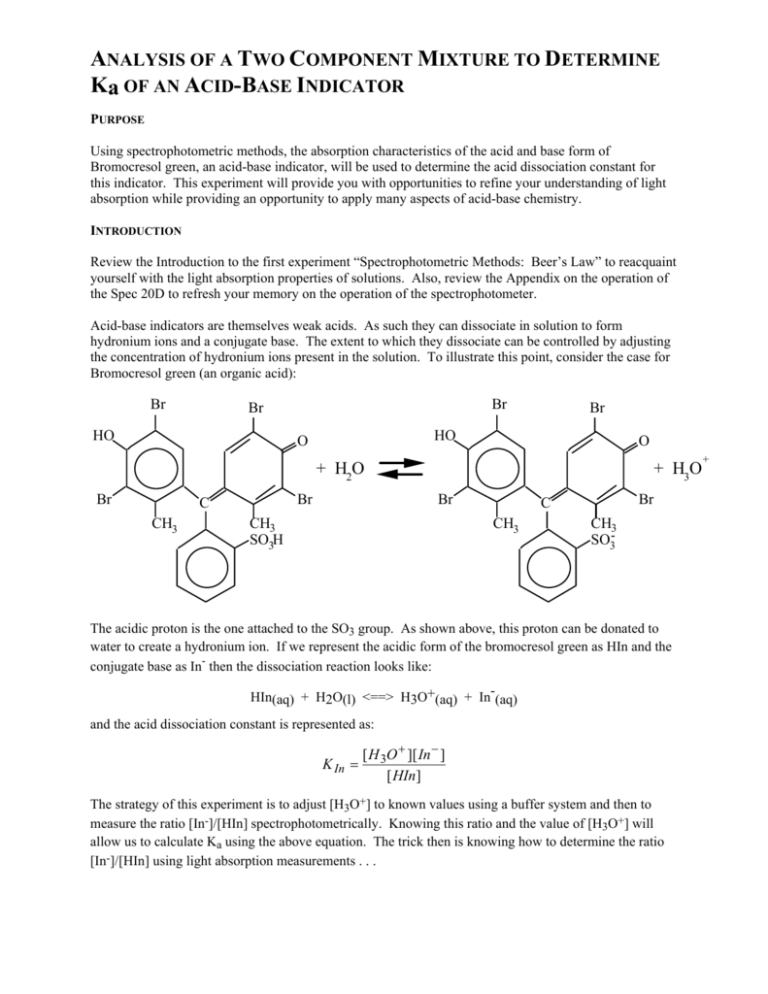
ANALYSIS OF A TWO COMPONENT MIXTURE TO DETERMINE Ka OF AN ACID-BASE INDICATOR PURPOSE Using spectrophotometric methods, the absorption characteristics of the acid and base form of Bromocresol green, an acid-base indicator, will be used to determine the acid dissociation constant for this indicator. This experiment will provide you with opportunities to refine your understanding of light absorption while providing an opportunity to apply many aspects of acid-base chemistry. INTRODUCTION Review the Introduction to the first experiment “Spectrophotometric Methods: Beer’s Law” to reacquaint yourself with the light absorption properties of solutions. Also, review the Appendix on the operation of the Spec 20D to refresh your memory on the operation of the spectrophotometer. Acid-base indicators are themselves weak acids. As such they can dissociate in solution to form hydronium ions and a conjugate base. The extent to which they dissociate can be controlled by adjusting the concentration of hydronium ions present in the solution. To illustrate this point, consider the case for Bromocresol green (an organic acid): Br Br Br HO Br HO O O + H2O Br Br C CH3 + H3O Br CH3 SO3H Br C CH3 CH3 SO3- The acidic proton is the one attached to the SO3 group. As shown above, this proton can be donated to water to create a hydronium ion. If we represent the acidic form of the bromocresol green as HIn and the conjugate base as In- then the dissociation reaction looks like: HIn(aq) + H2O(l) <==> H3O+(aq) + In-(aq) and the acid dissociation constant is represented as: K In = [ H 3O + ][ In − ] [ HIn] The strategy of this experiment is to adjust [H3O+] to known values using a buffer system and then to measure the ratio [In-]/[HIn] spectrophotometrically. Knowing this ratio and the value of [H3O+] will allow us to calculate Ka using the above equation. The trick then is knowing how to determine the ratio [In-]/[HIn] using light absorption measurements . . . + Controlling the pH The pH of all the solutions used in the lab today will NOT be controlled by the presence of the weak acid bromocresol green. The bromocresol green will always be present in very low concentrations when compared to other proton and/or hydroxide producing species. Therefore, the [H3O+] present in the bromocresol green equilibrium will be determined by other acid-base equilibria. Primarily, the pH of the solutions you will work with today will be determined by the presence of acetic acid and sodium acetate (a buffer system). The acetic acid dissociation equilibrium is: HOAc(aq) + H2O(l) <==> H3O+(aq) + OAc-(aq) and the [H3O+] present can be found from: [ H 3O + ] = K a [ HOAc] [OAc − ] where Ka = 1.75 x 10⁻⁵ for acetic acid. Light Absorption Characteristics The acid form of bromocresol green (HIn) absorbs light in a different region of the spectrum than the basic form of bromocresol green (In-). Examine the figure below, you can see that the two species have distinctly different values for λmax - this should come as no surprise. Acid-base indicators are useful for determining pH and indicating end-points because they change color as the pH of the solution changes. It is important to note that the two solutions used to measure these absorption curves each contained the same concentration of the bromocresol green indicator. Absorption Curves for BCG 0.7 0.6 Abs. of base form Abs. of acid form 0.5 0.4 0.3 0.2 0.1 0.0 400 425 450 475 500 525 550 Wavelength (nm) 2 575 600 625 We want to select a wavelength that will allow us to determine the relative amount of each species present. One very poor choice occurs at about 507 nm. At this wavelength each species absorbs equally well. The best choice will be at the wavelength which has the largest difference in absorbance for the two species. This occurs at λmax for the basic solution (at about 610 nm). Using Light Absorption to find [In-]/[HIn] In all of the solutions you use today, the total concentration of bromocresol green, BCG, (the sum of both the acidic and basic forms) will be the same. By the way, you will verify this fact in your Prelab. Let’s consider the implications of this. First, you adjust the pH of a BCG solution to a basic region which will assure that essentially 100 % of the BCG is in the basic form. You then determine the absorbance of this solution across the entire spectrum (from 400 - 625 nm). You determine the wavelength of maximum absorbance and call it λIn-. The absorbance of the basic solution at this wavelength will be called AIn-. Next, you adjust the pH of a BCG solution to an acidic region which will assure that essentially 100 % of the BCG is in the acidic form. You then determine the absorbance of this solution across the entire spectrum (from 400 - 625 nm). The absorbance of the acidic solution at the wavelength of maximum absorbance for the basic solution (λIn-) will be called AHIn. You could also adjust the pH of a BCG solution to a value equal the pKIn. In this case equal amounts of the acidic and basic forms would be present. You then determine the absorbance of this solution across the entire spectrum (from 400 - 625 nm). The absorbance of this solution at the wavelength of maximum absorbance for the basic solution (λIn-) will be equal to: Aobs = AHIn [ HIn] [ In − ] + AIn − [total ] [total ] where [total ] = [ HIn] + [ In − ] . By the way, this equation will be valid at any wavelength (as long as all solutions are measured at that wavelength) and for any ratio of [In-]/[HIn] (not just equimolar mixtures). The above relationship can be rearranged to find [In-]/[HIn] for any solution from the absorbance of the solution of interest (Aobs), the absorbance of the basic solution (AIn-), and the absorbance of the acidic solution (AHIn): [ In − ] ( Aobs − AHIn ) = [ HIn] ( AIn − − Aobs ) Once we have determined this ratio, it is simply a matter of knowing [H3O+] in order to find KIn using the relationship on page 55. You will find KIn for 5 separate solutions of different pH. As part of your Prelab you will set up a spreadsheet to determine the concentrations of many of the key solution components in each of these solutions. EQUIPMENT Each pair of students will have access to (a) 1.000 M acetic acid, HOAc, (b) 0.200 M sodium acetate, NaOAc, (c) 3.0 x 10⁻⁴ M BCG, (d) 3.0 M HCl containing 1.5 x 10⁻⁵ M BCG, (e) a Spec 20 and cuvettes, (f) the necessary glassware for pipetting and diluting solutions. PROCEDURE You will prepare a total of seven solutions on which you will make spectrophotometric measurements. These solutions will be prepared by successive additions (adding solution to the previous solution). Do not discard any solution or make any addition to a solution unless you are certain that you have completed the spectrophotometric measurements required for the solution. 3 1. Pipet 25.00 mL of 1.000 M acetic acid into your volumetric flask. Use a 5 mL pipet to add 5.00 mL of 3.0 x 10⁻⁴ M BCG to this same flask. Carefully dilute to a total volume of 100 mL and mix the solution thoroughly by inverting and turning the flask about 30 times. Pour this solution into a clean, dry E.flask and label it HOAc Stock Solution. Using proper technique, fill a 25 mL buret with this solution. 2. (a) Pipet 5.00 mL of 3.0 x 10⁻⁴ M BCG AND 5.00 mL of 0.200 M sodium acetate into a clean 100 mL flask and dilute carefully to 100 mL. Mix the solution thoroughly and pour it into a second clean, dry Erlenmeyer flask (E. flask). Label this solution 1, this solution contains BCG in essentially 100 % basic form. Record the color. (b) Fill a clean, dry cuvette with solution 1 and another with distilled water. Using the Spec 20, measure the absorbance of solution 1 from 400 600 nm in 25 nm increments AND from 600 - 625 in 5 nm increments. Determine the wavelength of maximum absorbance for the basic species (λIn-). Pour solution 1 from the cuvette back into the E. flask labeled solution 1. 3. (a) Using the buret filled in step (1) above, add 2.00 mL of HOAc Stock Solution to the E.flask labeled solution 1. Mix thoroughly by swirling and update the label to solution 2 (total volume = 102.0 mL). Record the color. (b) Fill a clean, dry cuvette with solution 2 and measure its absorbance at λIn- only Pour solution 2 from the cuvette back into the E. flask labeled solution 2. 4. (a) Add 2.00 mL of HOAc Stock Solution to the E.flask labeled solution 2. Mix thoroughly by swirling and update the label to solution 3 (total volume = 104.0 mL). Record the color. (b) Fill a clean, dry cuvette with solution 3 and measure its absorbance from 400 - 600 nm in 25 nm increments AND from 600 - 625 in 5 nm increments. Pour solution 3 from the cuvette back into the E. flask labeled solution 3. 5. (a) Add 2.00 mL of HOAc Stock Solution to the E.flask labeled solution 3. Mix thoroughly by swirling and update the label to solution 4 (total volume = 106.0 mL). Record the color. (b) Fill a clean, dry cuvette with solution 4 and measure its absorbance at λIn- only. Pour solution 4 from the cuvette back into the E. flask labeled solution 4. 6. (a) Add 2.00 mL of HOAc Stock Solution to the E.flask labeled solution 4. Mix thoroughly by swirling and update the label to solution 5 (total volume = 108.0 mL). Record the color. (b) Fill a clean, dry cuvette with solution 5 and measure its absorbance at λIn- only. Pour solution 5 from the cuvette back into the E. flask labeled solution 5. 7. (a) Add 2.00 mL of HOAc Stock Solution to the E.flask labeled solution 5. Mix thoroughly by swirling and update the label to solution 6 (total volume = 110.0 mL). Record the color. (b) Fill a clean, dry cuvette with solution 6 and measure its absorbance at λIn- only. Pour solution 6 from the cuvette back into the E. flask labeled solution 6. 8. (a) Add 1.00 mL of 3.0 M HCl containing 1.5 x 10⁻⁵ M BCG to the E.flask labeled solution 6. Mix thoroughly by swirling and update the label to solution 7 (total volume = 111.0 mL). Record the color. (b) Fill a clean, dry cuvette with solution 7 and measure its absorbance from 400 - 600 nm in 25 nm increments AND from 600 - 625 in 5 nm increments. Have the instructor review your data before cleaning up. REPORT Prepare a journal style (Analytical Chemistry) manuscript for this experiment. The report must be prepared on a computer. The required data manipulation and graphing should be carried out using a spreadsheet. The spreadsheets and necessary graphs should be submitted with the report. Make sure to include all data, graphs, and calculations that impact on the determination you have performed. 4 Complete the table below_(you may want to go ahead and set up a spreadsheet for this - it will pay off when you prepare your report) by calculating: (a) concentration of acetic acid, [HOAc], (b) concentration of acetate ions from sodium acetate, [OAc-], and (c) concentration of bromocresol green indicator (total conc. of both acidic and basic form) expected for each of the seven solutions you will prepare for the experiment (omit the following [HOAc] for solutions 1 and 7, and [OAc-] for solution 7). Show the equations you use in the space below. sol’n # mL HOAc Stock sol’n 1 0.00 mL 2 2.00 mL 3 4.00 mL 4 6.00 mL 5 8.00 mL 6 10.00 mL 7 ---------- total volume of sol’n [HOAc] [OAc-] [BCG]total ---------- ---------- ---------- Spreadsheets, Graphs, and Calculations: 1. Prepare a graph of A vs. wavelength (from 400 - 625 nm) for solutions 1, 3, and 7. Draw the best smooth cure through each data set. It would also be nice if you can plot A for the other solutions (2, 4, 5, 6) at λIn- (there are ways to make the spreadsheet do this). 2. Use the spreadsheet above as the starting point for the following (see below for some tips on the layout of your data table): (a) Calculation of the concentration of acetic acid, [HOAc], and the concentration of acetate ions from sodium acetate, [OAc-], for solutions 1 - 6 were carried out for the Prelab. Calculate [H3O+] for these same solutions from [HOAc], [OAc-], and the value of Ka for acetic acid (1.75 x 10⁻⁵) as discussed in the introduction. (b) Determine the ratio [In ]/[HIn] from the absorbances for solutions 2 - 6 using the Aobs for these solutions along with AIn- from solution 1 and AHIn from solution 7. (c) To find the value of KIn for bromocresol green, the following equation is used: The ratio of [In ]/[HIn] was found in step 2(b) and [H3O+] was KIn = ([In ]/[HIn])[H3O+] found in step 2(a). Helpful Hints: At a minimum, include the following in your spreadsheet (please do not type Aobs1, Aobs2, etc. in your spreadsheet - use your data!) 5 sol’n # 1 2 3 4 5 6 7 mL HOAc Stock sol’n sol’n # 1 2 3 4 5 6 7 Aobs Aobs1 = AInAobs2 Aobs3 Aobs4 Aobs5 Aobs6 Aobs7 = AHIn total volume of sol’n [HOAc] [OAc-] [BCG]total [H3O+] ---------- ---------- ---------- ---------- ---------- Aobs - AHIn AIn- - Aobs [In-]/[HIn] KIn pH color ---------- ---------- ---------- ---------- ---------- --------- ---------- ---------- ---------- ---------- ---------- --------- 3. Calculate the average acid dissociation constant for bromocresol green, KIn (omit any value that is “clearly different”). Look up the “accepted” value and calculate the % error. Did you do well? 4. Based on the color observations, what pH range would bromocresol green be an appropriate indicator for? Would this pH range be appropriate for titrations of (a) strong acids by strong bases, (b) weak acids by strong bases, or (c) weak bases by strong acids? Explain. 6
