Engineering Hydrology Lab Manual - KFUPM
advertisement
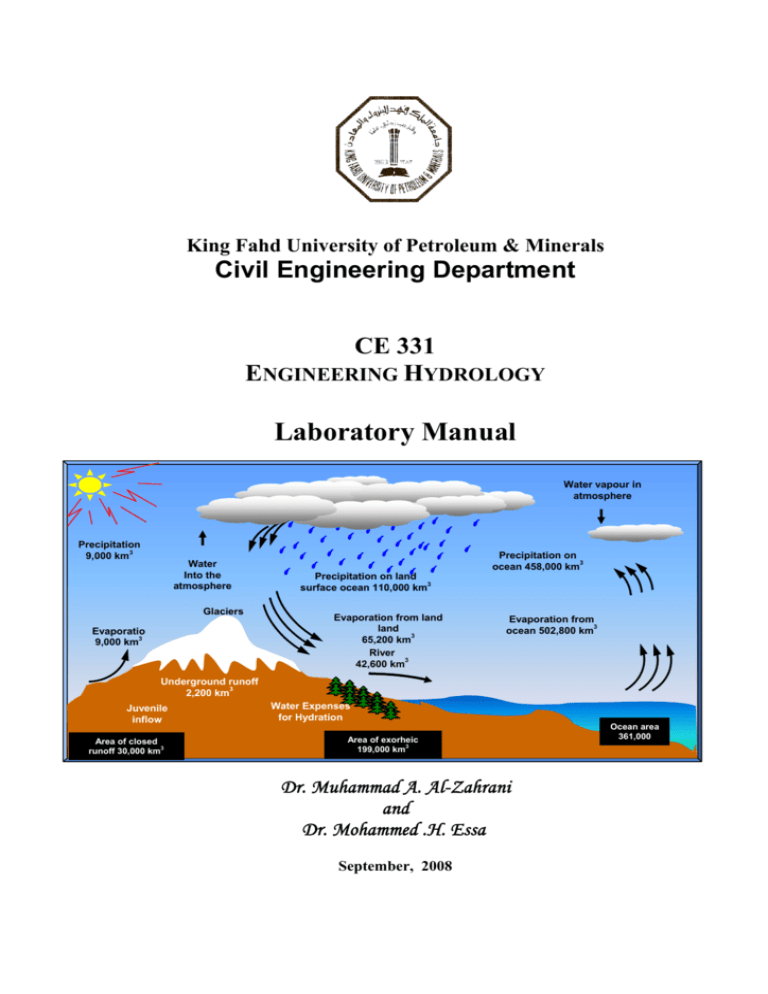
King Fahd University of Petroleum & Minerals Civil Engineering Department CE 331 ENGINEERING HYDROLOGY Laboratory Manual Water vapour in atmosphere Precipitation 3 9,000 km Water Into the atmosphere Glaciers Evaporatio 3 9,000 km Precipitation on 3 ocean 458,000 km Precipitation on land 3 surface ocean 110,000 km Evaporation from land land 3 65,200 km River 3 42,600 km Evaporation from 3 ocean 502,800 km Underground runoff 3 2,200 km Juvenile inflow Area of closed runoff 30,000 km3 Water Expenses for Hydration Area of exorheic 199,000 km3 Dr. Muhammad A. Al-Zahrani and Dr. Mohammed .H. Essa September, 2008 Ocean area 361,000 Table of Contents Page Preface …………………………………………………………………….. 1 Introduction ……………………………………………………………….. 1 Part I: Labs Related to Surface Hydrology ………………….... 1 1. 2. 3. 4. 5. 6. 7. 8. Hydrologic Cycle & Water Balance a) Hydrologic cycle ……………………………………………..….. b) Water Balance ……………………………………………….….. Precipitation …………………………………………………….….. Evaporation & Trnaspiration a) Evaporation ………………………………………………….….. b) Evapotranspirtaion ……………………………………….…….. Infiltration ………………………………………………………….. Rainfall-runoff relationship ……………………………………….. Stage Hydrographs ………………………………………………….. Development of an I-D-F curve …………………………………….. Frequency Analysis ………………………………………………….. Part II: Labs Related to Groundwater Hydrology …………….. 9. 10. 11. 12. Determination of Soil Hydraulic Characteristics ………………….. Application of Darcy’s Law ……………………………………….. Steady confined radial flow toward a well ………………………….. Steady unconfined radial flow toward a well ……………………….. Part III: Labs Related to Stormwater Drainage Design …….. 13. 14. 15. Peak discharge estimation ………………………………………….. Stormwater drainage system design – A …………………………….. Stormwater drainage system design – B …………………………….. PREFACE Hydrology is a science which encompasses the occurrence, distribution, movement, and properties of the waters of the earth and their relationship with the environment. Measurement of hydrological parameters constitutes an essential part of engineering hydrology. Such measurements are always carried out both in the laboratory and in the field in order to obtain information regarding the occurrence, distribution, movement and properties of the water. Such experiments help in the better understanding of the subject and in developing an aptitude for research work. The purpose of this laboratory manual is to introduce the Civil Engineering students to the basic principles of experiments in hydrology including procedures for data collection, computations and presentation of results. To make this manual more effective, it has been written in an easy style and a simple manner. Every care has been taken to make this manual as self- explanatory. Although every care has been taken to check the mistakes and misprints, yet it is difficult to claim this to be perfect. Any suggestions to improve this manual will be highly appreciated and will be incorporated in future prints. The authors take great pleasure in expressing their appreciation to Prof. Hamad I. Abdul-Wahab, Head of the Civil Engineering Department, for his encouragement and support. The authors accord their gratitude to Mr. Efren for typing the manuscript with utmost care and to Mr. Hussain for his excellent drafting work. INTRODUCTION The laboratory sessions are designed to support and supplement the theories introduced in the course and also to expose the students to some relevant applications. Students work in small groups on laboratory experiments; a total of 10 experiments must be completed during the semester. Each experiment and related materials will be first introduced by the instructor. It is very important before conducting any experiment to make sure that you understand how does the equipment work and what measurements have to be taken. Following each experiment, a student is required to write a report and submit it in time. Final examinations on the laboratory experiments may be held at the end of the semester. OBJECTIVES OF THE LABORATORY WORK 1. 2. 3. 4. 5. 6. To prepare the students to effectively link theory with practice and application and to demonstrate background of the theoretical aspects. To prepare the students to generate and analyze data using experiments and to apply elements of data statistics. To prepare students to have hands on experiments and to have exposure to equipment and machines To prepare the students to solve problems including design elements and related to their course work. To encourage the students to use computers in analyzing the data. To improve the student communication skills. LABORATORY REPORT Writing a technical report is very important in engineering practice. The experience gained from writing the laboratory reports will definitely help the student later during the preparation of his Co-op Report, Senior Project Report and in writing any Technical Report in his future career. The laboratory report should be presented in a factual, concise and complete manner and should be free of any ambiguous or contradicting statements. All pertinent data and sources of error should be noted. The interpretation of data and subsequent conclusions must be supported by the experimental results. The following is intended as a general aid in preparation of the laboratory report. The report consists of the following: (1) Cover Page The cover page should indicate the course name and number, the student’s name and number, the experiment title and number and the instructor’s name, etc. A sample cover sheet is shown next apage. (2) A Descriptive Title of the Experiment (3) Summary This part of the report should include an abridged and abbreviated, but complete, resumé of the information which follows. A paragraph (about 10 lines in length) is often sufficient, and never more than 20 lines (unless in certain circumstances such as a long thesis). The summary should give to the reader the sense of the report (i.e. the objectives, method and conclusions in a condensed form). (4) Introduction, Apparatus, and Procedure In most cases, reference need only be made to the experiment instruction sheets. However, when certain procedures were employed or were modified in such a way that they were not covered in the instruction sheets, it should then be recorded. (5) Discussion of Results This part represents the core of the report. All experiment findings must be discussed here in some detail. The student should refer to all tables, charts and graphs in his discussion. Although some numbers may be mentioned to support the discussion, a full table of measured data or calculated results should not be presented in this section. (6) Conclusions and Comments In some cases, certain questions are asked in the instruction sheets and these should be answered. However, in general, students are required to make brief pertinent conclusions of their own. Give reasons for any discrepancies which may have been noted between the obtained results and the expected theoretical results or trends. Well thought-out conclusions in the report are identification of the accomplishment (or not) of the objective of the experiment. The summary together with the conclusions form an important source of information for the busy reader. (7) Observed Data, Sample of Calculations and Computed Results A composite table of observations should be prepared from the experiment readings, with the proper units noted for each set of data. A sample of conclusions is usually necessary to show how the results, graphs and calculations are derived. All calculated data used for graphs and charts should be presented in a tabular form. All tables should be properly titled and clearly identified. (8) Graphs All graphs should also be properly titles and clearly labeled (such as Figure 1, Figure 2, etc.). Ordinate and abscissa scales of graphs should be carefully chosen to make the curves meaningful (i.e. scattering of points should be “compressed” as much as possible). On the other hand, a sufficiently large scale should be chosen so as to clearly define the trend of curves. Average curves should be drawn through plotted points. Graphs in pencil are permissible. Finally, it is important to note that the key word for writing a good report is brevity. There is absolutely no reason for the report to be too long. Such report is not required, and will result in no additional marks over a well-organized, concise and brief report. Two or three pages, with graphs, should be all that is required.
