14. THE LITHO-DENSITY LOG 14.1 Introduction 14.2 Theory 14.2.1
advertisement
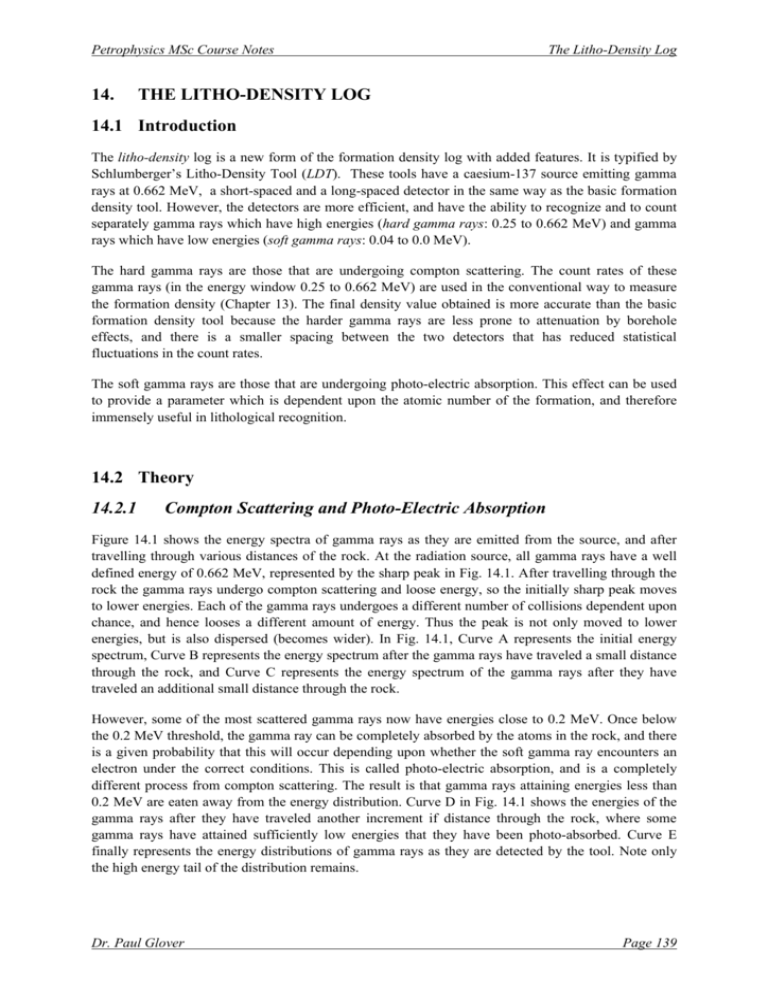
Petrophysics MSc Course Notes 14. The Litho-Density Log THE LITHO-DENSITY LOG 14.1 Introduction The litho-density log is a new form of the formation density log with added features. It is typified by Schlumberger’s Litho-Density Tool (LDT). These tools have a caesium-137 source emitting gamma rays at 0.662 MeV, a short-spaced and a long-spaced detector in the same way as the basic formation density tool. However, the detectors are more efficient, and have the ability to recognize and to count separately gamma rays which have high energies (hard gamma rays: 0.25 to 0.662 MeV) and gamma rays which have low energies (soft gamma rays: 0.04 to 0.0 MeV). The hard gamma rays are those that are undergoing compton scattering. The count rates of these gamma rays (in the energy window 0.25 to 0.662 MeV) are used in the conventional way to measure the formation density (Chapter 13). The final density value obtained is more accurate than the basic formation density tool because the harder gamma rays are less prone to attenuation by borehole effects, and there is a smaller spacing between the two detectors that has reduced statistical fluctuations in the count rates. The soft gamma rays are those that are undergoing photo-electric absorption. This effect can be used to provide a parameter which is dependent upon the atomic number of the formation, and therefore immensely useful in lithological recognition. 14.2 Theory 14.2.1 Compton Scattering and Photo-Electric Absorption Figure 14.1 shows the energy spectra of gamma rays as they are emitted from the source, and after travelling through various distances of the rock. At the radiation source, all gamma rays have a well defined energy of 0.662 MeV, represented by the sharp peak in Fig. 14.1. After travelling through the rock the gamma rays undergo compton scattering and loose energy, so the initially sharp peak moves to lower energies. Each of the gamma rays undergoes a different number of collisions dependent upon chance, and hence looses a different amount of energy. Thus the peak is not only moved to lower energies, but is also dispersed (becomes wider). In Fig. 14.1, Curve A represents the initial energy spectrum, Curve B represents the energy spectrum after the gamma rays have traveled a small distance through the rock, and Curve C represents the energy spectrum of the gamma rays after they have traveled an additional small distance through the rock. However, some of the most scattered gamma rays now have energies close to 0.2 MeV. Once below the 0.2 MeV threshold, the gamma ray can be completely absorbed by the atoms in the rock, and there is a given probability that this will occur depending upon whether the soft gamma ray encounters an electron under the correct conditions. This is called photo-electric absorption, and is a completely different process from compton scattering. The result is that gamma rays attaining energies less than 0.2 MeV are eaten away from the energy distribution. Curve D in Fig. 14.1 shows the energies of the gamma rays after they have traveled another increment if distance through the rock, where some gamma rays have attained sufficiently low energies that they have been photo-absorbed. Curve E finally represents the energy distributions of gamma rays as they are detected by the tool. Note only the high energy tail of the distribution remains. Dr. Paul Glover Page 139 Petrophysics MSc Course Notes The Litho-Density Log Count Rate A B C D E 0 0.1 0.2 0.3 0.4 0.5 0.6 0.7 Energy (MeV) Figure 14.1 Gamma ray energy spectra. Soft Gamma Ray Window Hard Gamma Ray Window Low U Low Z Count Rate Medium U Medium Z High U High Z 0.662 MeV Source 0 0.1 0.2 0.3 0.4 0.5 0.6 0.7 Energy (MeV) Figure 14.2 Gamma ray energy spectra and measurement windows. Dr. Paul Glover Page 140 Petrophysics MSc Course Notes The Litho-Density Log Different materials have different abilities to photo-absorb gamma rays. Figure 14.2 shows the energy spectra of gamma rays after travelling to the detector through three media with low, medium and high photo-electric absorption indices. We can use the count rates measured in the higher energy shaded window (for hard gamma rays) as a measure of compton scattering and hence the electron density of the material through which the gamma rays have passed. This gives information about the density of the formation in the same way as for the conventional formation density tool. The count rate of the soft gamma rays in the lower energy shaded window in Fig. 14.2 is a measure of the density of the material (how many electrons there are available to take part in photo-absorption) and the rate of photo-absorption per electron. Hence, the number of gamma rays reaching the detector in the lower energy window depends upon the effective electron density of the rock as well as the photo-electric capture cross-section of the material. 14.2.2 Specific Photo-Electric Absorption Index The probability that a gamma ray is adsorbed by the process of photo-electric absorption depends upon the characteristic cross-section of the process σe. Characteristic cross-sections are measured in barns, where 1 barn=10-24 cm2. A specific photo-electric absorption index Pe is defined with the relationship Pe ≡ where: Pe σe Z K = = = = 1 σe K Z (14.1) the photo-electric absorption index (barns/electron) the photo-electric cross-section (barns) the atomic number (number of electrons) a coefficient dependent upon the energy at which the photo-electric absorption is observed (no units). The specific photo-electric absorption index Pe of a material describes the likelihood that a gamma ray will be photo-electrically absorbed per electron of the atoms that compose the material. Both σe and K depend upon energy, but since they do so in the same way, their energy dependencies cancel out, and Pe is therefore independent of energy. The photo-electric absorption index can be approximated by the empirical relationship Z Pe = 10 3.6 (14.2) and values are given in Table 14.1. Dr. Paul Glover Page 141 Petrophysics MSc Course Notes 14.2.3 The Litho-Density Log Volumetric Photo-Electric Absorption Index The Volumetric photo-electric absorption index U of a material describes the likelihood that a gamma ray will be photo-electrically absorbed per unit volume of the material. It can be written in terms of the specific photo-electric absorption index as U = Pe ρ e (14.3) Table 14.1 Photo-electric data for common minerals and fluids. Mineral Formula Anhydrite Barite Biotite Calcite Dolomite CaSO4 BaSO4 K Feldspar Glauconite Gypsum Halite Haematite Limonite Magnetite Muscovite Pyrite Quartz Siderite Sylvite Zircon Shale Shaly Sand Anthracite Bituminous Coal Pure Water Salt Water Molecular Weight 136.15 233.37 Pe 100.09 184.42 5.055 266.82 6.30 5.084 3.142 CaSO4.2 H2O NaCl Fe2O3 172.18 2.86 5.32 3.420 MgCO3 231.55 CaCO3 CaCO3.M gCO3 58.45 159.70 FeS2 SiO2 FeCO3 KCl ZrSiO4 - 119.98 60.09 115.86 74.6 183.31 18.02 Oil H2O 120,000p pm NaCl (CH2)n Methane CH4 16.04 Z (equiv.) 15.69 47.2 ρb ρe ρa U 2.960 4.500 2.957 4.01 2.977 15.71 3.74 2.710 2.870 2.708 2.864 3.34 2.710 2.877 14.93 1070 21.03 13.77 9.00 2.62 3.95 2.350 7.51 21.00 9.37 2.031 9.68 107 46.67 113 7.90 82.1 4.79 55.9 15.83 311 14.07 2.320 2.372 4.169 21.48 13.00 22.24 2.40 16.97 1.806 1.69 8.510 69.10 3.42 2.70 0.161 0.180 15.30 23.45 2.165 5.240 2.074 4.987 23.65 5.180 4.922 6.02 6.21 1.700 1.400 1.749 1.468 2.642 2.41 1.683 1.383 0.358 0.807 7.52 9.42 1.000 1.086 1.110 1.185 1.000 1.080 0.398 0.850 0.119 5.53 0.850 0.948 0.826 0.095 5.21 0.250 0.136× ρoil 0.119× ρgas 3.59 3.29 21.96 11.78 21.09 18.13 32.45 14.07 5.000 2.654 3.940 1.984 4.560 2.650 4.834 2.650 1.916 4.279 2.645 2.648 3.89 1.862 0.15 6.52 Note the huge values for barite. Dr. Paul Glover Page 142 Petrophysics MSc Course Notes 14.2.4 The Litho-Density Log Factors Influencing the PEF Log Mean Atomic Number of the Matrix. The PEF log is mainly controlled by the mean atomic number of the formation (Eq. (14.2)). Hence we can draw the following conclusions: The higher Pe, the higher the mean atomic number of the formation. If there are isolated Pe peaks, this may indicate local deposits of heavy minerals especially those containing iron, or radioactive placer deposits (uranium and thorium). If there is a general high value for the Pe curve, this may indicate the presence of igneous or metamorphic rocks. The lower Pe, the lower the mean atomic number of the formation. Thin bands of low Pe may indicate coal. Pe Formation Fluids. The porosity and fluid saturations of rocks vary, and so it would be expected that the measured Pe and U values might also vary with changing porosity and fluid saturation in the same way that many other logs do. However, the values of Pe and U for the fluids commonly found in rock are so low compared with the values for the matrix, that their influence is negligible. The one exception to this is perhaps highly saturated brines, which may have a significant Pe value. Figure 14.3 shows how little influence up to 35% porosity changes have on the Pe values for quartz, limestone and dolomite. 10 9 8 7 6 5 4 3 2 1 0 Effect of water in pores Effect of gas in pores 5.08 Calcite 3.14 Dolomite 1.81 0 4.70 4.24 2.95 2.70 1.66 1.54 Quartz 10 20 30 40 Porosity (%) Figure 14.3 Pe as a function of porosity and fluid content. The PEF log is therefore sensitive to differences in the mean atomic number of a formation without being sensitive to changes in the porosity and fluid saturation of that lithology. This combination makes the PEF log an extremely good indicator of lithology. Dr. Paul Glover Page 143 Petrophysics MSc Course Notes The Litho-Density Log The ability of the PEF log to accurately indicate lithology is not impaired in gas-bearing zones, where the combination of the formation density and neutron logs may have difficulty distinguishing between lithologies. 14.3 Tool Operation The tool is physically very similar to the formation density tool. It has enhanced detectors, and the distance between the long spacing and the short spacing detectors has been decreased. This decrease has increased the vertical resolution of the tool and improved its overall counting accuracy. The accuracy of the density measurement of the litho-density tool is approximately 0.01 to 0.02 g/cm3, whereas that of the formation density tool is approximately 0.02 to 0.03 g/cm3. 14.4 Log Presentation The log is commonly referred to as the photo-electric factor log (PEF). It is shown in tracks 2 and 3 together with the formation density and neutron curves. Scales running from 0 to 10 or 0 to 15 or 0 to 20 barns/electron are most often used. As the PEF for most common rock forming minerals is low, this log usually sits to the left hand side of track 2. Depth (m) This log is commonly run combined with the neutron log and a gamma ray log. The combination of the formation density log with the neutron log and the PEF log is very powerful in lithological assessment. The gamma ray log is run to aid depth matching with other logs. Figure 14.4 shows the typical layout of LDT-CNL-GR tool combination. GR (GAPI) 0 100 CAL (IN) 6 16 1.95 45 0 RHOB (G/CM^3) 2.45 2.95 NPHI (PU) 15 Pe (barns/electron) -15 10 5 Sandstone Shale Limestone Dolomite Halite V V Anhydrite V V V V V V Figure 14.4 Layout of a typical LDT-CNL-GR tool run. Dr. Paul Glover Page 144 Petrophysics MSc Course Notes The Litho-Density Log 14.5 Depth of Investigation The density and PEF measurement from the litho-density tool have a depth of investigation of 50 to 60 cm, defined by the distance of the long spacing detector from the short spacing detector. 14.6 Vertical Resolution The density measurement from the litho-density tool has a vertical bed resolution of 50 to 60 cm, which is slightly better than the formation density tool. The enhanced vertical resolution results from the shorter distance between the short and the long spacing detectors. The PEF measurement has a slightly better vertical resolution still. This is because the PEF log relies almost solely on the long spacing detector rather than both detectors. It has, therefore, a smaller ‘footprint’. As with the formation density log, it is possible o enhance the vertical resolution of this log by slowing down the logging speed and using modern digital data processing. 14.7 Borehole Quality The litho-density suffers from the same borehole quality problems as the formation density tool, because of its similar borehole configuration (source and detectors pressed against the borehole wall). 14.8 Mud Type The tool can be used with any muds except those that contain barite. Reference to Table 14.1 shows that the Pe for barite is 267 barns/electron compared with values of less than 6 barns/electron for most common lithofacies. Barite is such an efficient absorber of gamma rays that it reduces the levels of gamma rays to levels to low to be measured accurately. Hence, the litho-density tool cannot be used with barite muds. 14.9 Uses of the Litho-Density Log 14.9.1 Determination of Lithology The litho-density log is one of the two most useful approaches to lithological determination downhole. This is because the tool is simply sensitive only to the mean atomic number of the formation, and at the same time is insensitive to changes in porosity and fluid saturation in the rock. Hence, the absolute Pe value may often be used to indicate directly the presence of a given lithology. This lithology may then be checked against the other tool readings for consistency. Figure 14.5 shows the response of the litho-density tool to common lithologies (also see Fig. 14.4). Dr. Paul Glover Page 145 Petrophysics MSc Course Notes The Litho-Density Log PEF (barns/electron) 0 10 Shale 3.3 0% 1.8 10% 1.7 Sandstone Limestone 0% 5.08 10% 4.9 Shale Dolomite 3.3 0% 3.14 10% Sandstone 20% Porosity 3.05 1.70 1.68 1.66 0.18 Gas Oil Water Coal 4.65 Halite Shale + Siderite Shale + caving Uncompact Barite off scale Cave 3.0 Shale Compact 5.0 Figure 14.5 Measurements of the photo-electric absorption (PEF) litho-density log for common lithologies. Note particularly that there are two common lithologies that cannot be distinguished by the gamma ray log easily. These are clean sandstones and clean limestones. It is clear from Figs. 14.4 and 14.5 that the PEF log can distinguish clearly and unambiguously between clean sandstones and clean limestones. Dr. Paul Glover Page 146 Petrophysics MSc Course Notes The Litho-Density Log Also, it can be seen from Fig. 14.4 that limestone and anhydrite cannot be distinguished by the PEF log. However, anhydrite will always show up with little or no porosity on the neutron log, and will have a bulk density always above 2.9 g/cm3, which compares with a maximum of 2.71 g/cm3 possible with a clean limestone. If there is a mixture of two mineralogies, for example a sandy limestone, a crossplot technique or a simple mixing rule can be applied to calculate the relative proportions of the two mineralogies. In the crossplot technique, the Pe value is plotted on the x-axis against bulk density on the y-axis (Figure 14.6). The point lies between lines that indicate the relative proportions of three lithologies (sandstone, dolomite and limestone). Figure 14.6 Matrix identification in a multi-mineral system using the PEF and density log data for a formation saturated with a fluid of density equal to 1.0 g/cm3. Dr. Paul Glover Page 147 Petrophysics MSc Course Notes The Litho-Density Log In the mixing rule method the relative proportions of two mineralogies may be calculated if one can obtain Pe values for each of the two pure mineralogies from fore-knowledge, standard values, or from log zones where each of the pure mineralogies are present. The mixing rule is simply (Pe )log where: (Pe)log (Pe)1 (Pe)2 χ1 (1-χ1) = = = = = = χ 1 (Pe )1 + (1 − χ 1 )(Pe )2 (14.4) the value of Pe measured in the zone of interest the value of Pe measured in mineralogy 1 the value of Pe measured in mineralogy 2 the volume fraction of mineralogy 1, where χ1+χ2=1.0. the volume fraction of mineralogy 2, where χ1+χ2=1.0. When three minerals are present (plus porosity), the Pe log values are used together with the formation density log values. These two logs are multiplied to give the volumetric photo-electric absorption index U (according to Eq. (14.3)). The reason for this lies in the sensitivities of each of the parameters in Eq. (14.3). The Pe value is mass related and, as has been discussed, is sensitive to lithology but rather insensitive to porosities and fluid saturations. By comparison, the bulk density is sensitive to changes in porosity and fluid saturation. The product of the Pe values and the bulk density values gives a U value, which is sensitive to both the lithological composition of the formation, as well as any changes in porosity that are lithologically controlled. The minerals are obtained from a cross-plot of the apparent bulk density ρmaa of the matrix against the apparent value of U for the matrix Umaa. The apparent bulk density ρmaa of the matrix is usually obtain from a density/neutron cross-plot (see Chapter 15). The matrix Umaa is obtained from U maa = (1 − φ )U ma + φ U f where: Umaa Uma Uf φ = = = = (14.5) the apparent volumetric photo-electric absorption index of the formation of interest the volumetric photo-electric absorption index of the formation matrix the volumetric photo-electric absorption index of the formation fluid the fractional porosity of the rock. The technique is very useful in complex carbonate-sand-evaporite systems where the porosity is controlled by the lithology, as is especially useful in gas-bearing zones, which do not alter significantly the Pe values. The technique is less useful in sand-shale sequences. 14.9.2 Detection of Heavy Minerals and Inter-Well Correlation Heavy minerals give particularly high PEF and U values, and can be used to help their recognition in logs. For example, siderite is often found in dense bands in shales and in limestone/dolomites. These bands give peaks in the density log that may be ‘lost’ in the general variation due to varying porosity. However, the PEF log is insensitive to changes in porosity. In such a case the PEF log will be flat over the logging interval except at the siderite band, which will show up as a clear peak that is correlated to one of the peaks in the density log. The U value logs of heavy minerals give even higher peaks. This is because the heavy minerals have a high PEF, due to their high mean atomic number, as well as a high bulk density. Dr. Paul Glover Page 148 Petrophysics MSc Course Notes The Litho-Density Log There are many heavy minerals which can be identified in small amounts on the PEF and U logs. The most common are, siderite, haematite, pyrite, glauconite and even biotite and muscovite micas. These heavy mineral bands are not esoteric lithologies from the point of view of the reservoir petrophysicist, as heavy mineral bands with characteristic signatures can be very useful in the correlation of formations between wells. 14.9.3 Fractures Most drilling fluids have very low PEF values. When this information is combined with he fact that the litho-density tool is pad mounted and pressed against the borehole wall, one can see that most types of drilling mud will not have a great effect on the PEF measurements. The exception is barite which has a huge PEF value and will swamp all other log responses if the tool sees barite drilling mud. Some people have used this to detect fractures. When there are fractures, the barite drilling mud will enter them, and the logged PEF value will saturate. While the hypothesis has been shown to work, it is not used in practice, since the barite drilling mud makes all other judgments from the log invalid. In practice PEF logs are not used in holes drilled with barite mud, and fractures are in general preferentially recognized by image logs. Dr. Paul Glover Page 149

