Bottled Water:
advertisement
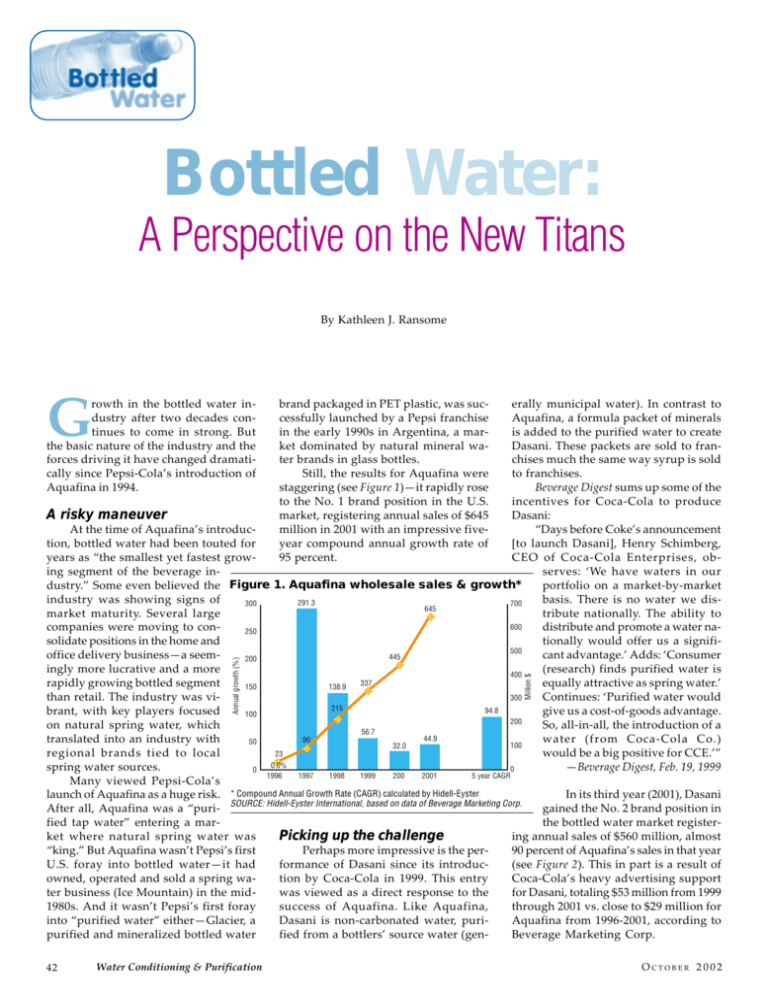
Bottled Water: A Perspective on the New Titans By Kathleen J. Ransome G rowth in the bottled water industry after two decades continues to come in strong. But the basic nature of the industry and the forces driving it have changed dramatically since Pepsi-Cola’s introduction of Aquafina in 1994. 42 Water Conditioning & Purification Million $ Annual growth (%) erally municipal water). In contrast to Aquafina, a formula packet of minerals is added to the purified water to create Dasani. These packets are sold to franchises much the same way syrup is sold to franchises. Beverage Digest sums up some of the incentives for Coca-Cola to produce A risky maneuver Dasani: At the time of Aquafina’s introduc“Days before Coke’s announcement tion, bottled water had been touted for [to launch Dasani], Henry Schimberg, years as “the smallest yet fastest growCEO of Coca-Cola Enterprises, obing segment of the beverage inserves: ‘We have waters in our dustry.” Some even believed the Figure 1. Aquafina wholesale sales & growth* portfolio on a market-by-market industry was showing signs of basis. There is no water we dis291.3 700 300 645 market maturity. Several large tribute nationally. The ability to 600 companies were moving to condistribute and promote a water na250 solidate positions in the home and tionally would offer us a signifi500 office delivery business—a seemcant advantage.’ Adds: ‘Consumer 445 200 ingly more lucrative and a more (research) finds purified water is 400 337 rapidly growing bottled segment equally attractive as spring water.’ 138.9 150 than retail. The industry was viContinues: ‘Purified water would 300 215 94.8 brant, with key players focused give us a cost-of-goods advantage. 100 200 on natural spring water, which So, all-in-all, the introduction of a 56.7 44.9 translated into an industry with water (from Coca-Cola Co.) 90 50 100 32.0 regional brands tied to local would be a big positive for CCE.’” 23 0.0% spring water sources. —Beverage Digest, Feb. 19, 1999 0 0 1996 1997 1998 1999 200 2001 5 year CAGR Many viewed Pepsi-Cola’s launch of Aquafina as a huge risk. * Compound Annual Growth Rate (CAGR) calculated by Hidell-Eyster In its third year (2001), Dasani After all, Aquafina was a “puri- SOURCE: Hidell-Eyster International, based on data of Beverage Marketing Corp. gained the No. 2 brand position in fied tap water” entering a marthe bottled water market registerPicking up the challenge ket where natural spring water was ing annual sales of $560 million, almost Perhaps more impressive is the per“king.” But Aquafina wasn’t Pepsi’s first 90 percent of Aquafina’s sales in that year formance of Dasani since its introducU.S. foray into bottled water—it had (see Figure 2). This in part is a result of tion by Coca-Cola in 1999. This entry owned, operated and sold a spring waCoca-Cola’s heavy advertising support was viewed as a direct response to the ter business (Ice Mountain) in the midfor Dasani, totaling $53 million from 1999 success of Aquafina. Like Aquafina, 1980s. And it wasn’t Pepsi’s first foray through 2001 vs. close to $29 million for Dasani is non-carbonated water, puriinto “purified water” either—Glacier, a Aquafina from 1996-2001, according to fied from a bottlers’ source water (genpurified and mineralized bottled water Beverage Marketing Corp. brand packaged in PET plastic, was successfully launched by a Pepsi franchise in the early 1990s in Argentina, a market dominated by natural mineral water brands in glass bottles. Still, the results for Aquafina were staggering (see Figure 1)—it rapidly rose to the No. 1 brand position in the U.S. market, registering annual sales of $645 million in 2001 with an impressive fiveyear compound annual growth rate of 95 percent. OCTOBER 2002 Bottled Water: A Perspective on the New Titans By Kathleen J. Ransome G rowth in the bottled water industry after two decades continues to come in strong. But the basic nature of the industry and the forces driving it have changed dramatically since Pepsi-Cola’s introduction of Aquafina in 1994. 42 Water Conditioning & Purification Million $ Annual growth (%) erally municipal water). In contrast to Aquafina, a formula packet of minerals is added to the purified water to create Dasani. These packets are sold to franchises much the same way syrup is sold to franchises. Beverage Digest sums up some of the incentives for Coca-Cola to produce A risky maneuver Dasani: At the time of Aquafina’s introduc“Days before Coke’s announcement tion, bottled water had been touted for [to launch Dasani], Henry Schimberg, years as “the smallest yet fastest growCEO of Coca-Cola Enterprises, obing segment of the beverage inserves: ‘We have waters in our dustry.” Some even believed the Figure 1. Aquafina wholesale sales & growth* portfolio on a market-by-market industry was showing signs of basis. There is no water we dis291.3 700 300 645 market maturity. Several large tribute nationally. The ability to 600 companies were moving to condistribute and promote a water na250 solidate positions in the home and tionally would offer us a signifi500 office delivery business—a seemcant advantage.’ Adds: ‘Consumer 445 200 ingly more lucrative and a more (research) finds purified water is 400 337 rapidly growing bottled segment equally attractive as spring water.’ 138.9 150 than retail. The industry was viContinues: ‘Purified water would 300 215 94.8 brant, with key players focused give us a cost-of-goods advantage. 100 200 on natural spring water, which So, all-in-all, the introduction of a 56.7 44.9 translated into an industry with water (from Coca-Cola Co.) 90 50 100 32.0 regional brands tied to local would be a big positive for CCE.’” 23 0.0% spring water sources. —Beverage Digest, Feb. 19, 1999 0 0 1996 1997 1998 1999 200 2001 5 year CAGR Many viewed Pepsi-Cola’s launch of Aquafina as a huge risk. * Compound Annual Growth Rate (CAGR) calculated by Hidell-Eyster In its third year (2001), Dasani After all, Aquafina was a “puri- SOURCE: Hidell-Eyster International, based on data of Beverage Marketing Corp. gained the No. 2 brand position in fied tap water” entering a marthe bottled water market registerPicking up the challenge ket where natural spring water was ing annual sales of $560 million, almost Perhaps more impressive is the per“king.” But Aquafina wasn’t Pepsi’s first 90 percent of Aquafina’s sales in that year formance of Dasani since its introducU.S. foray into bottled water—it had (see Figure 2). This in part is a result of tion by Coca-Cola in 1999. This entry owned, operated and sold a spring waCoca-Cola’s heavy advertising support was viewed as a direct response to the ter business (Ice Mountain) in the midfor Dasani, totaling $53 million from 1999 success of Aquafina. Like Aquafina, 1980s. And it wasn’t Pepsi’s first foray through 2001 vs. close to $29 million for Dasani is non-carbonated water, puriinto “purified water” either—Glacier, a Aquafina from 1996-2001, according to fied from a bottlers’ source water (genpurified and mineralized bottled water Beverage Marketing Corp. brand packaged in PET plastic, was successfully launched by a Pepsi franchise in the early 1990s in Argentina, a market dominated by natural mineral water brands in glass bottles. Still, the results for Aquafina were staggering (see Figure 1)—it rapidly rose to the No. 1 brand position in the U.S. market, registering annual sales of $645 million in 2001 with an impressive fiveyear compound annual growth rate of 95 percent. OCTOBER 2002 A market’s changing face Pepsi-Cola and Coca-Cola have changed the face of the bottled water industry: • They’ve proven that consumers have accepted purified drinking water. This is a distinct departure from traditional focus of the industry on natural spring water • They’ve created national brands in a market dominated by regional brands tied to specific spring water sources. • Their sole focus in the bottled water industry is on the convenience size PET segment, in contrast with other leading bottlers who focused on both the retail segment and home and office delivery. • They’ve achieved leading market positions from new brand development rather than acquisition. This contrasts sharply with the leading bottled water players, which have relied heavily on acquisition to increase market share. • They have built in economies of scale. They’re the market leaders in carbonated soft drinks, an industry six to seven times the size of the bottled water industry. They have nationwide state-of-the-art bottling facilities and blow molding operations. • They have the infrastructure to benefit from cost-effective nationwide distribution with strategically located production plants and distribution facilities. For example, Pepsi currently produces Aquafina in 27 U.S. locations. • They’re experts in beverage advertising and promotion. They’ve established relations with and the power to influence the distribution trade—retailers, wholesalers, food brokers, etc. They support their brands with large advertising and promotion budgets. All of this is within the context of the commitment made over a decade ago by Coca-Cola and Pepsi-Cola to the total beverage concept, with positions in iced teas, coffee drinks, fruit juice beverages, sports drinks and functional beverages. Functional beverages are those with some ingredients added about which health claim benefits can be made. These are regulated as food and the added ingredients must be “generally recognized as safe” (GRAS) under federal regulation. In the water category, Aquafina ESSENTIALS was introduced in May 2002 and Dasani Nutriwater is slated to be launched soon. These waters don’t meet the FDA definition of • Circle 70 on Reader Service Card • 44 Water Conditioning & Purification bottled water—but rather are beverages. Ingredients may include flavors/essences, vitamins, fructose/glucose and other agents that may impart a health benefit such as fiber, gingko biloba, cholesterol lowering agents, to name a few. The impact is felt Needless to say, the bottled water industry has felt the impact. There’s no questions Aquafina and Dasani may have created incremental sales for the industry overall, but there is also no question that these brands have displaced sales that would have been realized by the key bottled water players active in Pepsi-Cola’s and Coca-Cola’s distribution outlets—primarily Nestle, Danone and Suntory. • Nestle Waters of North America (the No. 1 bottled water company in the U.S.): If Nestle had not purchased Aberfoyle Springs in Ontario, Canada, and Black Mountain Spring Water in California in 2001, its share of the U.S. bottled water market would have decreased in 2001. Nestle—whose flagship has been Perrier—is launching its own NESTLE brand of bottled water. • Danone Waters of North American (No. 2): Danone’s sales and market share • Circle 69 on Reader Service Card • OCTOBER 2002 were clearly impacted by Pepsi-Cola and Coca-Cola. The company chose not to engage in the competitive price war in bottled water and not to focus on the U.S. market. Danone’s Riboud stated, “Under no circumstances will we let our margins deteriorate by chasing market share.” Danone’s recent agreements with Coca-Cola reflect Danone’s resolve. Danone launched its DANNON brand of spring water in 1996 as a moderately priced national bottled water brand. This brand has been surpassed by Aquafina and Dasani. • Suntory Water Group (No. 5 after Pepsi-Cola and Coca-Cola): Since 1999, Suntory has been bumped from No. 2 to the No. 5 position. Danone’s purchase of the McKesson Water Group in January 2000 moved Suntory from No. 2 in 1999 to No. 3 in 2000. Pepsi-Cola and Coca-Cola usurped Suntory’s No. 3 position in 2001 moving it to position No. 5. In the same year, Suntory suffered a $4 million loss of sales in 2001 and close to a 1.5 percent decline in market share. Aquafina and Dasani accounted for approximately half of the industry’s growth in sales dollars in 2000 and in 2001. There is no question that PepsiCola and Coca-Cola will continue to play a key role in the future direction of the industry. Conclusion Many believe that the three key bottled water players moving forward will be Nestle, Pepsi-Cola and Coca-Cola. It remains to be seen whether Pepsi-Cola and Coca-Cola will enter the U.S. home and office delivery business. While the PET segment of the bottled water industry has been “inundated” by the entry of Aquafina and Dasani, the home and office delivery segment has experienced competition from point-of-use (POU) players, such as Culligan, and in some cases bottlers have incorporated POU coolers into their offering. The POU business has economic potential that merits close examination. About the author Kathleen Ransome is director of the Beverage Division of Hidell-Eyster International. She provides business and financial consulting services for international clients in market research, strategy development, business plans, and mergers and acquisitions. She’s also a past member of the WC&P Technical Review Committee and remains active in the International Bottled Water Association. She can be reached at (781) 748-8040, (781) 7492304 (fax) or email: ransome@hidelleyster.com OCTOBER 2002 Bottled Water: By the Numbers The following statistics are courtesy of Beverage Marketing Corp., of New York U.S. BOTTLED WATER MARKET U.S. BOTTLED WATER MARKET Volume and Producer Revenues (1991–2001) Per Capita Consumption (1991–2001) Year 1991 1992 1993 1994 1995 1996 1997 1998 1999 2000 2001 Millions of Gallons 2,355.9 2,486.6 2,689.4 2,966.4 3,226.9 3,495.1 3,794.3 4,130.7 4,583.4 4,904.4 5,425.3 Annual Millions of Annual % Change Dollars % Change 2.1 $2,512.9 -0.6 5.5 $2,658.7 5.8 8.2 $2,876.7 8.2 10.3 $3,164.3 10.0 8.8 $3,521.9 11.3 8.3 $3,835.4 8.9 8.6 $4,222.7 10.1 8.9 $4,666.1 10.5 11.0 $5,314.7 13.9 7.0 $5,809.0 9.3 10.6 $6,477.0 11.5 Year 1991 1992 1993 1994 1995 1996 1997 1998 1999 2000 2001 Gallons Annual Per Capita % Change 9.3 — 9.8 4.7 10.5 7.4 11.5 9.4 12.2 6.4 13.1 7.4 14.1 7.4 15.3 8.3 16.8 10.0 17.8 6.0 19.5 9.4 U.S. BOTTLED WATER MARKET Volume & Growth by Segment (1991–2001) Year Non-Sparkling Volume* % Change 1991 1992 1993 1994 1995 1996 1997 1998 1999 2000 2001 2,112.2 2,228.0 2,422.2 2,687.6 2,965.6 3,224.3 3,491.4 3,823.8 4,286.3 4,622.4 5,157.4 2.6 5.5 8.7 11.0 10.3 8.7 8.3 9.5 12.1 7.8 11.6 Sparkling Volume* % Change 172.3 172.3 174.7 174.8 164.2 159.0 153.8 146.1 146.0 144.2 144.0 -2.1 0.0 1.4 0.1 -6.1 -3.2 -3.3 -5.0 -0.1 -1.2 -0.1 Imports Volume* % Change 71.4 86.3 92.5 104.0 97.1 111.8 149.1 160.8 151.1 137.8 123.9 -3.4 20.9 7.2 12.4 -6.6 15.1 33.4 7.8 -6.0 -8.8 -10.1 Total Volume* % Change 2,355.9 2,486.6 2,689.4 2,966.4 3,226.9 3,495.1 3,794.3 4,130.7 4,583.4 4,904.4 5,425.3 2.1 5.5 8.2 10.3 8.8 8.3 8.6 8.9 11.0 7.0 10.6 * Millions of gallons GLOBAL BOTTLED WATER MARKET GLOBAL BOTTLED WATER MARKET Leading Countries’ Consumption and Compound Annual Growth Rates, or CAGR (1996–2001) Per Capita Consumption by Leading Countries (1996–2001) Millions of Gallons 2001 CAGR Rank Countries 1996 2001 1996/01 1 U.S. 3,495.1 5,425.3 9.2% 2 Mexico 2,674.2 3,496.5 5.5% 3 Italy 1,923.9 2,502.6 5.4% 4 Germany 2,097.6 2,336.5 2.2% 5 France 1,498.9 2,064.6 6.6% 6 China 565.0 2,007.8 28.9% 7 Indonesia 512.1 1,352.1 21.4% 8 Thailand 854.5 1,198.3 7.0% 9 Brazil 475.7 1,139.6 19.1% 10 Spain 884.0 1,091.4 4.3% Top 10 Subtotal 14,981.0 22,614.6 8.6% All Others 4,205.4 7,488.4 12.2% WORLD TOTAL 19,186.4 30,103.0 9.4% 2001 Rank Countries 1 Italy 2 France 3 Mexico 4 Belgium-Lux. 5 U.A.E. 6 Germany 7 Spain 8 Switzerland 9 Lebanon 10 Saudi Arabia 11 Austria 12 Cyprus 13 Czech Republic 14 United States 15 Thailand Global Average Gallons Per Capita 1996 2001 33.5 43.4 25.7 34.7 28.1 34.3 28.8 32.6 25.7 31.3 25.6 28.1 22.3 27.3 21.1 23.8 12.7 22.5 15.1 22.5 18.5 20.5 14.2 20.2 12.9 19.6 13.1 19.5 14.5 19.4 3.3 4.9 SOURCE: Beverage Marketing Corp. Water Conditioning & Purification 45
