PC Postprocessing Technologies:
A Competitive Analysis
Dolby Home Theater v4
SRS Premium Sound
Waves MaxxAudio 3
Abstract
In a scientifically rigorous analysis of audio postprocessing technologies for laptop computers
conducted by one of the world’s leading research and teaching institutions, based in the San
Francisco Bay Area, consumers clearly preferred Dolby® Home Theater ® v4 for overall sound.
The preference was particularly strong in the 20–30 age bracket, and listeners
in general cited better loudness, dialogue clarity, and spaciousness for the Dolby technology.
The study, the most comprehensive ever done in this field, compared Dolby Home Theater v4
with Waves MaxxAudio 3 and SRS Premium Sound™ on identical laptop models from Dell
and Samsung. A total of 78 listeners compared sound in the absence of postprocessing
technologies, with the manufacturer’s included postprocessing technology (SRS or Waves),
and with Dolby Home Theater v4. Laptops under test were the Dell® XPS™ 15 and Samsung
RF511. All audio was judged using each computer’s built-in speakers. Listeners evaluated the
sound using digital samples from movie soundtracks and music, and were asked to judge the
audio for overall preference and several specific characteristics. Neither the laptop models nor
the postprocessing technologies were identified at any time to the listeners, and all tests were
performed with the computers placed behind an opaque, acoustically transparent screen.
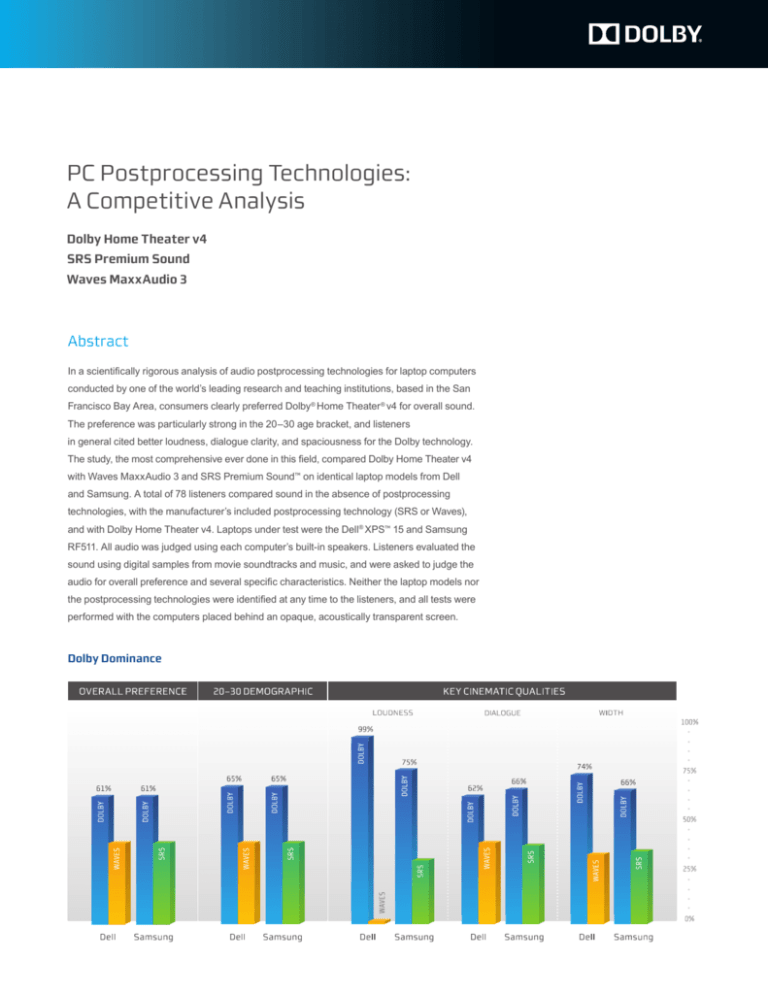
Dolby Dominance
Background
Today’s PCs are not just productivity devices but often the primary entertainment device for
consumers. While desktop PCs can be easily outfitted with third-party add-ons ranging from
large-screen monitors to external speakers, laptops cannot be expanded without sacrificing
the portability that makes them popular.
In addition, laptop designs limit the size of built-in speakers and the power of built-in
amplifiers. Users on the go can watch movies on bright, sharp screens, but the audio quality
often doesn’t match.
Dolby Laboratories and other companies have developed postprocessing technology suites
to address many of the laptop audio shortcomings. All of these make the same promises—
realistic, cinema-style sound that immerses you in the onscreen action or music. At Dolby,
however, we believe that our Dolby Home Theater v4 suite improves laptop audio more
effectively than competing technologies.
We were confident enough in this belief to commission a research institution to conduct a
comprehensive scientific analysis of Dolby Home Theater v4 and competing technologies. The
institution compared popular laptops that use technologies from SRS and Waves, exactly as
supplied by the laptop manufacturer, to identical machines with Dolby Home Theater v4. The
institution also selected the participants, oversaw the setup, and ran the study independently
on campus.
Test setup for laptop comparisons
Graphic 1: Listeners were seated at a normal working distance relative to the laptops but
could not see or touch them.
PC Postprocessing Technologies: A Competitive Analysis
2
The table below summarizes feature judgments made for music and
movie content:
Test Parameter
Music
Movie
Overall Preference
Instinctive choice independent of specific audio characteristics
X
X
Loudness
Crucial to immersing the listener in the audio, especially on small
portable consumer devices
X
X
Dialogue Clarity
Vital to enjoying a movie soundtrack
X
Sound Width
Gives a small laptop a large, spacious sound
X
Bass
Enhanced low frequencies necessary for full-range music reproduction
X
Spectral Naturalness
Subjective sense of natural sound
X
X
Methodology
All tests followed a general paradigm that included an overall preference judgment and a
multifeature comparison using a two-interval-forced-choice procedure (2IFC). We believe
that the methodology used in this test is the most rigorous competitive analysis of consumer
computer subjective audio quality. All studies were performed by an unbiased third party
using untrained listeners from a broad sampling of age groups and listening expertise.
Most important, the test was performed in a blind unbranded setting. The 2IFC procedure
is a widely used psychophysical paradigm known for providing an unbiased measure of
a judgment or performance. Presentation orders, presentation balancing, and content
types were all randomized or controlled to ensure an unbiased robust result that was not
indicative of a specific content or listening scenario. Timing between presentations and
content durations also were all carefully controlled to optimize listener memory and minimize
presentation ordering effects.
Testing involved six separate laptop PCs: two models, each with three separate laptop
PCs per model. For each model, all three PCs included different audio implementations:
(a) with all postprocessing technologies removed, (b) with the competitive technology
(SRS or Waves) as shipped from the manufacturer, and (c) with Dolby Home Theater v4
installed as the postprocessing solution. The laptops with competing technologies
were supplied to the testing institution directly by the manufacturer: Dell XPS 15 (with
Waves MaxxAudio 3) and Samsung RF511 (with SRS Premium Sound). Dolby supplied
identical models, one pair including Dolby Home Theater v4 technologies and one pair
with postprocessing technologies disabled, as described above. All postprocessing
technologies were played using the native profiles suggested for movie or music content
as provided from the manufacturer.
For each trial, a listener sat behind an acoustically transparent but visually opaque screen.
The laptops were mounted on a turntable to allow rapid placement in front of the listener in a
PC Postprocessing Technologies: A Competitive Analysis
3
position identical to how they’re typically used. Listeners first heard the unprocessed audio
from either movie or music content. They then heard the same sample played on PCs with
Dolby Home Theater v4 and the competing technology. The order of presentation for the
processed audio was determined by randomization within the framework of a 50–50 split.
During each trial, listeners heard three identical sets of 10- to 15-second music or movie
samples presented serially from both PCs under test. An approximately 1.5-second silence
was included between each PC presentation. Following the first listening of all three audio
implementations, each subject was asked to choose his or her overall listening preference for
either of the postprocessing suites.
The second and third presentations of the content set followed completion of the preference
ratings. Listeners were then asked to make similar 2IFC judgments, this time with respect
to subjective parameters. Following the second listening, listeners were asked to judge the
postprocessing suite that increased the loudness and maintained the spectral naturalness
relative to the unprocessed audio for all content. Listeners were always instructed to make
these judgments independently of preference and to strictly judge the feature at test.
Listeners were also asked to judge low-frequency enhancement (bass) for music content and
speech clarity for movie content.
On another repetition listeners were instructed to judge which presentation of the audio had
the widest sound image (virtualization). This was measured using a 2IFC judgment, and was
only tested for movie content.
Key Audio Characteristics Definitions and Results
Overall Preference
Respondents selected and orally reported the processed technology that sounded best to
them. So as to obtain an instinctive preference, they were not asked to judge or identify any
specific sonic characteristics.
Compared to Waves (Dell), 61 percent of the listeners preferred Dolby Home Theater v4.
Listener preference for Dolby Home Theater v4 compared to SRS (Samsung) was also
61 percent. In the 20–30 age bracket, this overall preference for Dolby compared to both
technologies rose to 65 percent.
Loudness
Respondents selected and orally reported the laptop presentation they perceived as louder.
Loudness is a particularly important parameter for a postprocessing suite: If a laptop cannot
achieve adequate volume, many of the other processing parameters will be inaudible in most
listening situations. In addition, movie soundtracks require a wide dynamic range to deliver their
full effects. The volume level was set to maximum for all laptops.
Compared to SRS (Samsung), 75 percent of the listeners perceived Dolby Home Theater v4 to
be louder. The comparison with Waves (Dell) was even more definitive—99 percent perceived
Dolby Home Theater v4 as louder. In the 20–30 age bracket, the results were similar: 74 percent
selected Dolby versus SRS and 99 percent selected Dolby versus Waves.
PC Postprocessing Technologies: A Competitive Analysis
4
Dialogue Clarity
Respondents selected and orally reported the laptop audio experience they perceived to have
better speech quality in comparison to the unprocessed audio.
Compared to Waves, 62 percent of the listeners judged Dolby Home Theater v4 to deliver
clearer dialogue. The figure rose to 66 percent compared to SRS.
Sound Width (Virtualization)
Respondents selected and orally reported the laptop presentation that sounded wider and
more spacious. Sound width indicates how well a postprocessing technology delivers a
spacious, enveloping, and surrounding sound. It’s another key parameter, as the small sonic
footprint of laptops that lack audio processing particularly detracts from the video-watching
experience. A wide, involving audio experience more fully engages viewers and helps them
forget they’re watching on a small screen.
Compared to SRS, 66 percent of the listeners judged Dolby Home Theater v4 to provide a wider
and more spacious sound, and 74 percent preferred Dolby over Waves. In the 20–30 demographic,
these figures rose to 68 percent compared to SRS and 87 percent compared to Waves.
Additional Characteristics Judged
Bass
Respondents selected and orally reported the laptop presentation they perceived to be richer
in low frequencies.
Spectral Naturalness
Respondents selected and orally reported the laptop audio experience they perceived
to be the most natural. Although spectral naturalness is highly subjective, the aim was to
understand how listeners perceived the processed transformation of the original sound and
how consistent this feature was with a listener’s overall preference.
Note that the term “spectral naturalness” can actually represent many dimensions of a
sound’s quality. Listeners were not given a definition of the term, nor were they asked to
provide one. The primary intent was to understand how listeners’ judgments of this subjective
quality related to their overall preference for each of the tested postprocessing technologies
and how consistent this judgment was with the other tested features: loudness, bass,
dialogue clarity, and sound width. It was entirely expected that this variable would have
different meanings from person to person.
Complete Results
The described study generated extensive data comparing computer audio technologies.
In addition to the aggregate results and device types, we also broke out results for three
different age groups (20–30, 30–40, 40–55), and two content types (music or movie).
PC Postprocessing Technologies: A Competitive Analysis
5
To determine the statistical significance of the results (all primary results discussed were
found to be highly significant, p<0.01), a nonparametric test of randomization was performed
using common statistical resampling methods including bootstrapping and Monte Carlo
simulation methods. This test and these techniques are extremely robust metrics that are
conservative in falsely identifying statistical significance.
The graphs following provide the complete breakdowns:
Overall – Per Manufacturer
Overall – Per Manufacturer
99%
100
100
N=651
Dolby
Dell
61%
62%
57%
59%
40
Samsung
Dolb y
SRS
80
74%
Percent Chosen
Percent Chosen
80
60
N=657
Waves
20
60
75%
66%
62%
61%
66%
50%
40
20
0
0
Preference
Loudness
Bass
Dialogue
Spectral
Naturalness
Sound
Widt h
Preference
Loudness
Bass
Dialogue
Spectral
Naturalness
Sound
Widt h
N = Number of trials included in overall PREFERENCE rating represented in each graph.
Overall Movie – Per Manufacturer
99%
100
N=343
ll
Overall Movie – Per Manufacturer
100
96%
Dolby
Dell
N=349
Waves
80
Dolb y
Samsung
SRS
80%
80
60
66%
63%
62%
59%
Percent Chosen
Percent Chosen
71%
40
20
66%
60
51%
40
20
0
0
Preference
Loudness
Dialogue
Spectral
Naturalness
Sound
Widt h
Preference
Loudness
Dialogue
Spectral
Naturalness
Sound
Widt h
N = Number of trials included in overall PREFERENCE rating represented in each graph.
100
Overall Music – Per Manufacturer
99%
N=308
Overall Music – Per Manufacturer
100
Dolby
Dell
N=308
Waves
Dolb y
SRS
80
80
62%
58%
60
55%
40
20
Percent Chosen
Percent Chosen
Samsung
62%
60
56%
53%
51%
40
20
0
0
Preference
Loudness
Bass
Spectral
Naturalness
Preference
Loudness
Bass
Spectral
Naturalness
N = Number of trials included in overall PREFERENCE rating represented in each graph.
PC Postprocessing Technologies: A Competitive Analysis
6
100
100
100
80
80
80
60
60
60
40
40
40
20
20
20
0
0
0
100
100
100
80
80
80
60
60
60
40
40
40
20
20
20
0
0
0
PC Postprocessing Technologies: A Competitive Analysis
7
Dolby Laboratories, Inc.
100 Potrero Avenue, San Francisco, CA 94103-4813 USA dolby.com
T 415-558-0200 F 415-645-4000
Dolby and the double-D symbol are registered trademarks of Dolby Laboratories. © 2011 Dolby Laboratories, Inc. All rights reserved.
S11/24974


