VisualDSP3.0New.qxd
5/6/03
2:10 PM
Page 1
Key Featur es
Integrated Development and Debugging
Environment
l Develop and debug within a single
interface
l Profile and trace instruction execution of
C/C++ and assembly programs
l Set watch points (conditional breakpoints)
on processor registers and stacks, as well
as program and data memory including:
- Statistical profiling
- MP (multiple processor support)
- Graphical plotting
l Define all project and tool configurations
through property page dialog boxes
l Set project-wide or individual file settings
for debug or release mode project builds
l Create source file using an integrated, fullfeatured editor with syntax highlighting,
advanced search/find/replace, and bookmarks
l VisualDSP++ Kernel (VDK)
l VisualDSP++ Component Software
Engineering (VCSE)
l Background Telemetry Channel Support
l Pipeline viewer
l Cache visualization
Code Generation Key Featur es
Develop applications using an optimizing
C/C++ compiler
l Intersperse inline assembly statements
within C/C++ source code
l Create executables using a linker that
supports multiprocessing, shared memory,
and code overlays
l Access numerous math, DSP, and C/C++
runtime library routines
l Expert linker
l Enhanced assembler
l
Overview
TM
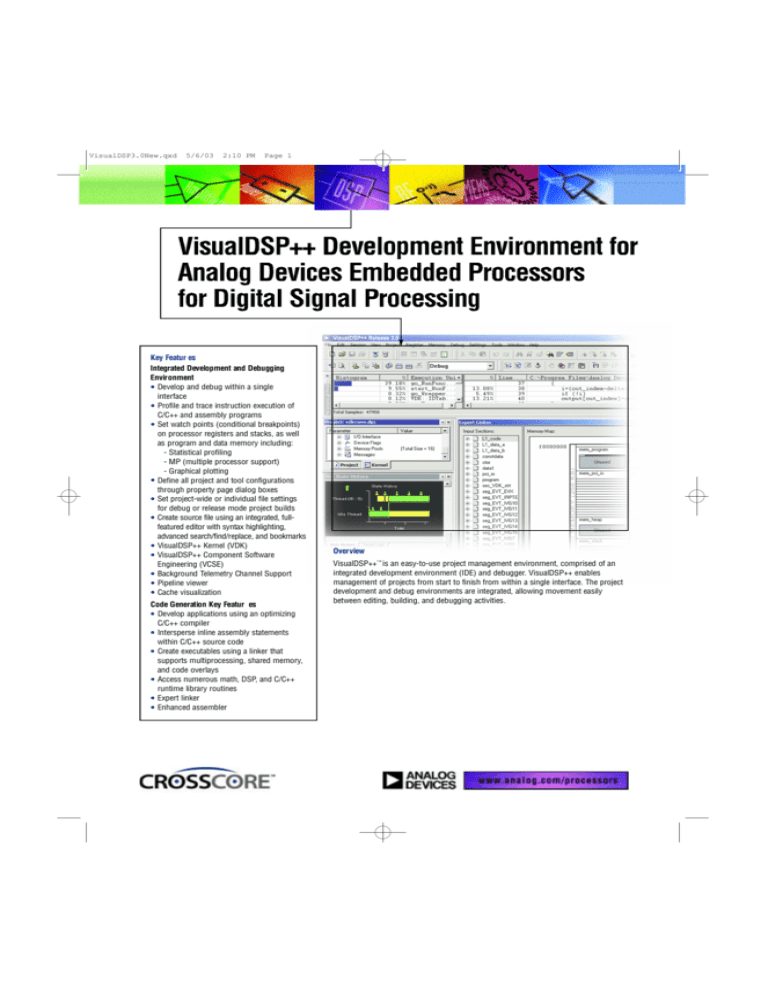
VisualDSP++ is an easy-to-use project management environment, comprised of an
integrated development environment (IDE) and debugger. VisualDSP++ enables
management of projects from start to finish from within a single interface. The project
development and debug environments are integrated, allowing movement easily
between editing, building, and debugging activities.
VisualDSP3.0New.qxd
5/6/03
2:10 PM
Page 2
Platform and Processor Support
VisualDSP++ Ker nel
VisualDSP++ supports the Blackfin® Processor, TigerSHARC®
Processor, SHARC® DSP, ADSP-218x, ADSP-2199x and ADSP-219x
DSP families on Windows® 98, Windows NT, Windows 2000, and
Windows XP. Refer to ADI’s web site for specifications and
availability at www.analog.com.
The VisualDSP++ Kernel (VDK) provides state-of-the-art scheduling
and resource allocation techniques tailored specifically to address the
memory and timing constraints of programming. These techniques
enable engineers to use example code more efficiently, eliminating the
need to start from the very beginning. The VDK has standard libraries
and frameworks with defined APIs that allow easy inclusion of
boilerplate, class libraries and value-added IP code.
Flexible Project Management
The IDE provides flexible project management for the development of
applications. The IDE includes access to all the activities necessary to
create and debug projects. The IDE editor allows the creation or
modification of source files or viewing of listing or map files. This
powerful editor is part of the IDE and includes multiple language
syntax highlighting, advanced search/find/replace, bookmarks, and
standard editing operations such as undo/redo, find/replace,
copy/paste/cut, and go to.
The IDE allows access to the C/C++ compiler, C/C++ runtime library,
assembler, linker, loader, and splitter. Specification of options for these
tools is made possible through the property page dialogs. Property
page dialogs are easy to use and simplify configuring, changing, and
managing projects. These options may be defined once and then
modified to meet changing development needs. The code generation
tools can be accessed from the operating system command line.
Automation API
The new Automation API enables additional features and functionality
to be added into the VisualDSP++ environment via an ActiveX plug-in.
Third Parties will be able to seamlessly port their software to the
VisualDSP++ front-end. Developers will be able to merge tool suites
together to improve design, analysis and verification and will only need
to learn one interface to use ADI Third Party Tools.
MP Support
VisualDSP++ multiple processor support (MP) provides a seamless
interface to debug multiple processors on the same physical hardware.
Users are able to issue parallel step, run, and halt commands to all of
the applicable processors. The developer can pick and choose
individual processor register or memory sets of interest by pinning
those that should be updated between runs, halts and steps. This
feature also eliminates screen clutter in multiple processor debugging.
Greatly Reduce Debugging T ime
The VisualDSP++ debugger has an easy-to-use, common interface to
all simulators and emulators available through Analog Devices, Inc.
(ADI) and many from participating parties. The debugger has many
features that greatly reduce debugging time. C/C++ source can be
viewed interspersed with the resulting assembly code. Users can
profile execution of a range of instructions in a program; set watch
points on hardware and software registers, program and data memory;
and trace instruction execution and memory accesses. These features
enable users to correct coding errors, identify bottlenecks, and
examine signal processor performance. The custom register option
allows developers to select any combination of registers to view in a
single window. The debugger, when used with the simulator, can also
generate inputs, outputs, and interrupts to simulate real world
application conditions. With C++ developers can realize a significant
increase in time to market with the ability to efficiently work with
complex signal processing data types and take advantage of
specialized operations without having to understand the underlying
architecture. VisualDSP++ simplifies development via common
development environment across all Analog Devices hardware and
embedded processors.
Reduced Debugging T ime
VisualDSP++
Development
Environment
Software
Simulator
EZ-KIT Lite ™
Hardware
Emulator
Hardware
Third-Party
Hardware
Blackfin Processor, TigerSHARC Processor, SHARC DSP, ADSP-21xx DSP
MP Dialog Box
Background Telemetr y Channel Support
The Background Telemetry Channel (BTC) feature is a mechanism for
exchanging data between a host and target application, with minimal
intrusion on the target system’s “real-time” characteristics. The
principal for data exchange is a shared group of registers that both the
host and the target have read/write access to while the application is
running. BTC enables real-time data collection and status messaging,
eliminating the overhead involved with halting the target application,
getting the desired information, and then restarting the target
application. BTC is currently supported on ADI’s Blackfin® Processor
family as well as ADI’s ADSP-219x DSP family with VisualDSP++
release 3.0 and above
VisualDSP3.0New.qxd
5/6/03
2:10 PM
Page 3
Statistical Pr ofiling
Code Generation T ools
Statistical profiling allows for a more generalized form of profiling that
JTAG emulator debug targets can take advantage of. The debugger has
the ability to unintrusively sample the target processors PC and then
present the user with a graphical display of the resultant samples. This
allows the user to easily see where their application is spending most
of its time.
Code generation tools allow development of applications that take full
advantage of the processors architecture, including multiprocessing,
shared memory, and memory overlays. Code generation tools include
VisualDSP++ Component Software Engineering, C/C++ compiler,
C/C++ runtime library, DSP and math libraries, assembler, linker,
loader and splitter. Code generation tools work seamlessly within the
VisualDSP++ environment.
Graphical Plotting
There are numerous types of plotting options, including Line,
Constellation, Eye Diagrams, 3D waterfall plots. The Plotting engine is
also capable of doing some simple data processing on the data before
it is displayed.
Statistical Profiling and Graphical Plotting
C/C++ Compiler and Assembler
The C/C++ compiler generates efficient code that is optimized for
both code density and execution time. The C/C++ compiler can be
easily interfaced with assembly code modules so that users can
program in C/C++ and still use assembly for time-critical loops. The
math, DSP, and C/C++ runtime library routines help shorten time to
market. The Blackfin Processor, TigerSHARC Processor, SHARC
DSP, ADSP-218x (ADSP-218x does not have C++ support) and
ADSP-219x DSP family assembly language is based on an algebraic
syntax that is easy to learn, program, and debug.
The enhanced assembler helps the programmer write optimal
assembly code by analyzing code sequences and providing feedback
to the user on latencies and stalls. Feedback is given as warnings
and informational messages out of the assembler and in the
assembler listing.
Compiled Simulation
VisualDSP++ Component Software Engineering (VCSE)
VCSE supports an Interface Definition Language (IDL) and compiler
that allows developers to create and use components without having
to become familiar with the detail of the model and the mechanisms it
involves, allowing them to concentrate on the application itself.
Component Software is designed to function as a re-usable part of a
larger program. Components can easily be integrated into an
application and are reusable. Integration with VisualDSP++ simplifies
the process of incorporating and utilizing components from a variety
of developers.
Cache
The Blackfin Processor simulator collects cache statistics that are
associated with both the PC/Source Line and the Cache Line/Set.
Collectable statistics are; Total Cache Accesses, Cache Hits, and Cache
Misses. There will be three types of displays: Histogram by PC/Source
Line, Cache Line Display where hit/miss data is associated by Cache
Line/Set(way), Summary Display of totals for hits/misses by cache.
Pipeline V iewer
The Pipeline Viewer is an ActiveX plug-in that allows a user to visually
display the instruction flow through the sequencer's pipeline. Stalls,
aborts and other pipeline events are graphically displayed.
Visualization of the pipeline and of the pipeline events allows a user to
better understand where and why latencies and stalls are being
introduced into an executable. Armed with this knowledge the user can
optimize an executable's instruction sequence to minimize the number
of pipeline events.
Traditionally, a standard simulator fetches, decodes and then simulates
each instruction that an application executes. Decoding each
instruction can have a significant cost, as it has to be effected each
time the instruction is executed. With Compiled Simulation, the
simulation compiler examines the whole application once and
generates C code for each instruction in the application, essentially
building a C program that is particularized to execute that one
application. After the generated code has been compiled and linked
with the necessary support libraries, the generated application can be
used to simulate that one application very efficiently (at speed of 100
to 1000 times faster than the ordinary simulator). When running under
the VisualDSP++ environment the generated compiled simulation
application can be debugged in the same way as with the ordinary
simulator, or be run as a stand-alone win32 executable.
Linker and Loader
The linker provides flexible system definition through linker description
files (.ldf). In a single .ldf file users are able to define different types of
executables for a single or multiprocessor system. The linker resolves
symbols over multiple executables, maximizes memory use, and
allows common code to be shared among multiple processors. The
loader supports creation of host, link port, and PROM boot images.
Along with the linker, the loader allows multiprocessor system
configuration with smaller code and faster boot time.
VisualDSP3.0New.qxd
5/6/03
2:10 PM
Page 4
Expert Linker
The “Expert” Linker creates a graphical utility that
makes it easier for users to produce Linker
Description File (LDF) without having to learn the
LDF syntax. The graphical representation of the
commands in an LDF file also allows the engineer to
manipulate the graphical representation for changes
to the LDF or generation of an LDF file. The Expert
Linker also allows users to optimize their placement
of code.
The DSP Collaborative
TM
The VisualDSP++ environment enables independent
third-party companies to add value using ADI’s
published set of application programming interfaces
(API’s). The DSP Collaborative is a comprehensive
collection of DSP development support companies.
The DSP Collaborative product offerings – real-time
operating systems, emulators, high-level language
compilers, and multiprocessor hardware can
interface seamlessly with VisualDSP++ thereby
simplifying development across all platforms and
targets.
Take A VisualDSP++ Test Drive!
Take a free 90-day test drive of
VisualDSP++. To take a test drive you
can: download a test drive from
the ADI DSP Tools web site at
www.analog.com/processors/tools/testdrive or
contact your local ADI Sales
representative/distributor.
Analog Devices’ Tools Product Line
TM
CROSSCORE , Analog Devices’ development tools
product line, provides easier and more robust
methods for engineers to develop and optimize
systems by shortening product development cycles
for faster time-to-market.
The CROSSCORE components include the
VisualDSP++ software development environment,
EZ-KIT Lite evaluation systems, and emulators for
rapid on-chip debugging. VisualDSP++ is an
TM
© 2003 Analog Devices, Inc. All rights reserved.
Trademarks and registered trademarks are the
property of their respective companies.
Printed in the U.S.A.
H02330-2-3/03 (F)
integrated software development environment
allowing for fast and easy development, debug, and
deployment. Emulators are available for PCI and
USB host platforms. The EZ-KIT Lite evaluation
system provides an easy way to investigate the
power of the ADI’s family of processors to develop
applications.
Analog Devices is committed to continuous
expansion of leading-edge development solutions
for design engineers everywhere.
For more information on the tools product line visit
the Analog Devices website:
www.analog.com/processors/tools .
Analog Devices Processors and DSPs
Analog Devices is a leading supplier of embedded
processing solutions, from the low power
ADSP-21xx DSP Families, to the high-performance
Blackfin® Processors, TigerSHARC® Processors,
and SHARC® DSPs, to integrated mixed-signal
DSPs for an increasing spectrum of applications.
Our advances in design provide faster processing,
more memory, lower power consumption, and
simplified system integration. ADI gives you a
competitive edge by providing a complete solution
including expert technical support, comprehensive
development tools, and an independent network of
third party developers called the DSP Collaborative .
For more information about ADI processors and
DSPs, visit www.analog.com/processors .
TM
CROSSCORE Tools Support
Tel: 1-800-ANALOGD
Email: dsptools@analog.com
Web: www.analog.com/processors/tools
Ordering Information
Please call Analog Devices CROSSCORE Tools at
603/883-2430 or your local ADI sales
representative or distributor for pricing and
ordering information for part number:
VDSP-SHARC-PC, VDSP-BLKFN-PC,
VDSP-21XX-PC, or VDSP-TS-PC.
Worldwide
Headquarters
One Technology Way
P.O. Box 9106
Norwood, MA
02062-9106, U.S.A.
Tel: 781.329.4700,
(1.800.262.5643,
U.S.A. only)
Fax: 781.326.8703
Analog Devices, Inc.
Europe
c/o Analog Devices SA
17–19, rue Georges Besse
Parc de Haute
Technologie d’Antony
F-92182
Antony Cedex, France
Tel: 33.1.46.74.45.00
Fax: 33.1.46.74.45.01
Analog Devices, Inc.
Japan Headquarters
New Pier Takeshiba
South Tower Building
1-16-1 Kaigan,
Minato-ku Tokyo
105-6891, Japan
Tel: 813.5402.8210
Fax: 813.5402.1063
Analog Devices, Inc.
Southeast Asia
Headquarte rs
4501 Nat West Tower
Times Square
1 Matheson Street
Causeway Bay
Hong Kong, PRC
Tel: 852.2.506.9336
Fax: 852.2.506.4755
DSP Support
U.S.A.:
dsp.support@analog.com
Fax: 781.461.3010
Europe:
dsp.europe@analog.com
Fax: 49.89.76903.557
www.analog.com/processors
