Batavia Stock Focus
29 June 2012
Unilever Indonesia
Expansion Set to Tap Growing Demand
•
Solid 1Q12 result
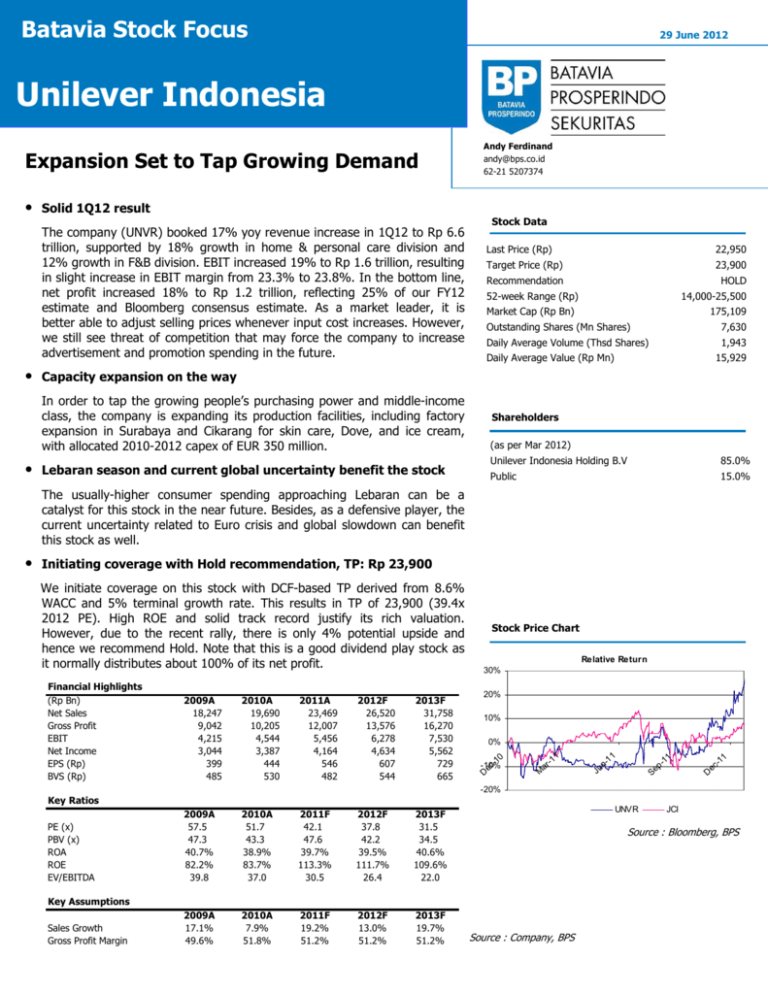
The company (UNVR) booked 17% yoy revenue increase in 1Q12 to Rp 6.6
trillion, supported by 18% growth in home & personal care division and
12% growth in F&B division. EBIT increased 19% to Rp 1.6 trillion, resulting
in slight increase in EBIT margin from 23.3% to 23.8%. In the bottom line,
net profit increased 18% to Rp 1.2 trillion, reflecting 25% of our FY12
estimate and Bloomberg consensus estimate. As a market leader, it is
better able to adjust selling prices whenever input cost increases. However,
we still see threat of competition that may force the company to increase
advertisement and promotion spending in the future.
•
Stock Data
Last Price (Rp)
22,950
Target Price (Rp)
23,900
Recommendation
HOLD
52-week Range (Rp)
14,000-25,500
Market Cap (Rp Bn)
175,109
Outstanding Shares (Mn Shares)
7,630
Daily Average Volume (Thsd Shares)
1,943
Daily Average Value (Rp Mn)
15,929
Capacity expansion on the way
In order to tap the growing people’s purchasing power and middle-income
class, the company is expanding its production facilities, including factory
expansion in Surabaya and Cikarang for skin care, Dove, and ice cream,
with allocated 2010-2012 capex of EUR 350 million.
•
Andy Ferdinand
andy@bps.co.id
62-21 5207374
Lebaran season and current global uncertainty benefit the stock
Shareholders
(as per Mar 2012)
Unilever Indonesia Holding B.V
85.0%
Public
15.0%
The usually-higher consumer spending approaching Lebaran can be a
catalyst for this stock in the near future. Besides, as a defensive player, the
current uncertainty related to Euro crisis and global slowdown can benefit
this stock as well.
•
Initiating coverage with Hold recommendation, TP: Rp 23,900
We initiate coverage on this stock with DCF-based TP derived from 8.6%
WACC and 5% terminal growth rate. This results in TP of 23,900 (39.4x
2012 PE). High ROE and solid track record justify its rich valuation.
However, due to the recent rally, there is only 4% potential upside and
hence we recommend Hold. Note that this is a good dividend play stock as
it normally distributes about 100% of its net profit.
Financial Highlights
(Rp Bn)
Net Sales
Gross Profit
EBIT
Net Income
EPS (Rp)
BVS (Rp)
2009A
18,247
9,042
4,215
3,044
399
485
2010A
19,690
10,205
4,544
3,387
444
530
2011A
23,469
12,007
5,456
4,164
546
482
2012F
26,520
13,576
6,278
4,634
607
544
2013F
31,758
16,270
7,530
5,562
729
665
Stock Price Chart
Relative Return
30%
20%
10%
0%
10
c-10%
De
ar
M
-1
1
11
nJu
11
pSe
11
cDe
-20%
Key Ratios
PE (x)
PBV (x)
ROA
ROE
EV/EBITDA
2009A
57.5
47.3
40.7%
82.2%
39.8
2010A
51.7
43.3
38.9%
83.7%
37.0
2011F
42.1
47.6
39.7%
113.3%
30.5
2012F
37.8
42.2
39.5%
111.7%
26.4
2013F
31.5
34.5
40.6%
109.6%
22.0
2009A
17.1%
49.6%
2010A
7.9%
51.8%
2011F
19.2%
51.2%
2012F
13.0%
51.2%
2013F
19.7%
51.2%
UNVR
Source : Bloomberg, BPS
Key Assumptions
Sales Growth
Gross Profit Margin
JCI
Source : Company, BPS
Batavia Stock Focus
Industry View
•
Expecting increase in purchasing power going forward
We view that the current global economic slowdown and Euro crisis do not affect local economy significantly. The flight of
investors to USD as safe haven may depreciate IDR, however BI is currently much more aggressive and has higher foreign
reserves to maintain currency stability. We view that GDP growth can still book more than 6% in this year. On the other
hand, relatively high national food stock, weakening global commodity prices, and unlikely increase in subsidized fuel price
may give downward pressure on inflation. Hence, purchasing power can increase and it is good for consumer industry.
GDP Growth
BI Rate and Inflation
8
10
(%)
(%)
7
6
5
5
0
Jan- Jul- Jan- Jul- Jan- Jul- Jan- Jul- Jan- Jul- Jan07 07 08 08 09 09 10 10 11 11 12
4
3
2007
2008
2009
2010
2011
Inflation (YoY)
1Q12
Source : Bloomberg, BPS
BI Rate
Source : Bloomberg, BI
Consumer Confidence Index
125
120
115
110
105
100
95
90
Worry on fuel price increase
Confidence rebounds
Index above 100 indicates optimism
Jan-11
•
Apr-11
Jul-11
Oct-11
Jan-12
Source : BI
Apr-12
Middle-income class on the rise
According to World Bank, Indonesia’s middle income class has risen significantly. In 2003, 37.7% of the total population
was the middle income class. In 2010, this class occupied 56.5% of the total population or about 134 million of people. The
remainder was mostly low income class with daily spending of lower than USD 2. The profile of this middle class is shown
on the pie chart. This is consistent with the growing GDP per capita, which booked 4-yr CAGR of 17%.
GDP per Capita
Profile of Middle Income Class by Daily
Spending, 2010
USD
USD 6-10 USD 10-20
2%
9%
USD 5-6
21%
USD 2-4
68%
Source : World Bank
2
4,000
3,500
3,000
2,500
2,000
1,500
1,000
500
0
2007
2008
2009
2010
2011
Source : World Bank, BPS
Batavia Stock Focus
•
Tough competition remains
The increasing middle income class and relatively low barrier to entry, such as relatively light regulation, have been a
magnet that attracts foreign consumer players. The industry has currently a huge number of players. In home & personal
care, there are Lion Wings, P&G, OT, Kao, and Unilever. Meanwhile in F&B, Heinz, Nestle, Indofood, and Unilever are
among the big players. Besides that, the nature of some products which are easily substituted makes competition even
tougher. Therefore, product innovation and rejuvenation remain an important factor.
Category
Toothpaste
Hair Care
Skin Care
Dishwashing
Detergent
Ice Cream
Ketchup
Some Well-known Products
Pepsodent, Ciptadent, Colgate, Formula, Smile Up,
Fresh & White
Pantene, Rejoice, Head & Shoulder, Sunsilk, Clear,
Emeron, Zinc
Emeron, Lux, Lifebuoy, Dove, Nuvo, Giv
Sunlight, Mama Lemon
Attack, Rinso, So Klin
Wall's, Campina, Woody, Haagen Dazs
Bango, Indofood, ABC
Source : BPS
Company View
•
A market leader, established in 1933
The company was established in 1933 under the name of Lever’s Zeepfabrieken N.V. in Angke, Jakarta. It grew through
organic and inorganic way and became a market leader in many categories of consumer goods. It currently has 2 revenue
segments, namely home & personal care and food & beverages. The former presently contributes 75% of revenue.
•
Strong inorganic growth
A lot of significant acquisitions have been done along the years.
1933
▼ Established under the name of Lever's Zeepfabrieken N.V. in Angke, Jakarta
1981
▼ Went public and listed 15% of shares in Jakarta and Surabaya Stock Exchange
1990
▼ Acquired The Sari Wangi
1992
▼ Entered ice cream business
1999
▼ Acquired fabrics conditioner and household care business
2000
▼ Acquired Kecap Bango
2004
▼ Acquired Knorr
2008
▼ Acquired Buavita and Gogo
Established the biggest skin care factory in Asia in Bekasi
2011
▼ Acquired Sara Lee
Source : Company, BPS
3
Batavia Stock Focus
•
Extensive operating facilities
Source : Company
•
Operational and Financial Review
UNVR is a market leader in many categories, such as skin care, hair care, skin cleansing, deodorants, oral care, tea, and ice
cream. At present, about 95% of the products are sold domestically and the rest is exported. In toothpaste segment, based
on Industry Ministry as reported by ICN Data Consult, national toothpaste production capacity was 92,000 ton in 2010.
UNVR contributed 56,500 ton or 61% of it with Pepsodent as the leading brand.
As a market leader in many categories, the company is better able to adjust selling prices whenever material cost
increases. It also has currency hedging to protect against sharp currency movement. Related to production cost, the
company keeps maintaining low cost such as through local-based supply and use of technology. As a result, it can maintain
profit margin as shown in the graph on the following page.
Currently, the company is expanding its production facilities with allocated capital expenditure of EUR 350 million for 20102012. The graph on the next page shows capex over previous year sales increased from about 4% to more than 7%. That
expansion includes factory expansion for skin care, ice cream, and Dove. Revenue from both divisions, namely home &
personal care and food & beverages is to increase. This is inline with the company’s plan to double the revenue by 2020
and make Indonesia as a production base for Asia.
4
Batavia Stock Focus
Division Revenue
Profitability
20,000
25,000
20,000
(Rp bn)
(Rp bn)
15,000
10,000
5,000
15,000
10,000
5,000
-
-
2008
2009
2010
Home & Personal Care
2011
2008
Food & Beverages
2009
Net Sales
Source : Company, BPS
2010
EBIT
2011
Net Profit
Source : Company, BPS
Capex/Previous Year Sales
Profit Margin
8.0%
7.0%
6.0%
5.0%
4.0%
3.0%
2.0%
1.0%
0.0%
60.0%
50.0%
40.0%
30.0%
20.0%
10.0%
0.0%
2008
2009
2010
2011
Source : Company, BPS
2008
2009
2010
2011
Source : Company, BPS
SWOT Analysis
•
Strength
•
•
•
•
Foreign-owned company faces increasing resistance towards acquisition and domination in local consumer
market
Growing middle-income class and higher purchasing power
High potential export market
Weakness and Threat
•
•
5
Strong financial performance with zero debt
Opportunity
•
•
•
Long operational experience
Weakness
•
•
Market leader with well-known brand names
Stiffer competition as barrier to entry is relatively low
Relatively high threat of product substitutes
Batavia Stock Focus
Valuation
•
Rich valuation justified
Based on 8.6% WACC and 5% terminal growth rate, our DCF-based model arrives at TP of 23,900 (39.4x 2012 PE). High
ROE and strong track record justify the rich valuation.
Peer Comparison
Market Cap
(Rp bn)
175,109
42,365
32,944
38,846
19,547
118,716
53,294
UNVR
INDF
ICBP
KLBF
MYOR
GGRM
CPIN
Last Price
(Rp)
22,950
4,825
5,650
3,825
25,500
61,700
3,250
2012 PE
2012 PBV
2012 EV/EBITDA
42.2
2.0
2.8
4.9
6.8
4.3
6.7
26.4
4.9
8.4
12.0
16.7
14.1
13.7
37.8
12.1
14.4
19.2
29.3
21.1
17.8
Source : Bloomberg, BPS
Historical Rolling PE
PBV vs ROE
45
50.0
40
UNVR
PE
35
40.0
+1 Stdev
25
+2 Stdev
PBV
Ave
30
-1 Stdev
20
-2 Stdev
15
10
Dec-09
Jun-10
Dec-10
Jun-11
30.0
20.0INDF, GGRM, MYOR,
ICBP, KLBF
10.0
CPIN
0.0%
50.0%
Dec-11
100.0%
ROE
Source : Bloomberg
Source : Bloomberg, BPS
Financial Summary
Interim Result
(Rp Bn)
Net Sales
COGS
Gross Profit
EBIT
Net Income
GPM
EBIT Margin
NPM
4Q11
1Q12
6,147
3,030
3,117
1,405
1,139
6,604
3,288
3,316
1,570
1,163
51%
23%
19%
50%
24%
18%
%Chg qoq
7%
9%
6%
12%
2%
1Q11
1Q12
%Chg yoy
5,668
2,780
2,888
1,323
987
6,604
3,288
3,316
1,570
1,163
50%
24%
18%
17%
18%
15%
19%
18%
52%
23%
17%
FY12
26,520
12,944
13,576
6,278
4,634
% Acc
25%
25%
24%
25%
25%
51%
24%
17%
Source : Company, BPS
6
Batavia Stock Focus
Financial Forecast
(Rp Bn)
2009
2010
2011
2012F
2013F
18,247
9,205
9,042
4,827
4,215
34
4,248
(1,205)
1
3,044
19,690
9,485
10,205
5,661
4,544
3
4,546
(1,161)
2
3,387
23,469
11,462
12,007
6,551
5,456
120
5,576
(1,411)
(1)
4,164
26,520
12,944
13,576
7,298
6,278
(73)
6,205
(1,570)
(1)
4,634
31,758
15,488
16,270
8,740
7,530
(82)
7,448
(1,885)
(1)
5,562
Balance Sheet
Current Assets
Cash and Equivalents
Receivables, Net
Inventories, Net
Other Current Assets
Non-current Assets
Fixed Assets
Intangibles
Others
Total Assets
Current Liabilities
Loans
Payables
Others
Non-current Liabilities
LT Debt
Other Non-current Liabilities
Total Liabilities
Minority Interests
Shareholders' Equity
Capital
Retained Earnings
Others
3,602
858
1,258
1,340
146
3,883
3,036
741
106
7,485
3,589
0
1,430
2,159
187
0
187
3,776
6
3,703
92
3,531
81
3,748
318
1,568
1,574
289
4,952
4,149
708
95
8,701
4,403
190
1,817
2,396
250
0
250
4,653
3
4,045
92
3,873
81
4,446
336
2,076
1,813
221
6,036
5,314
646
76
10,482
6,474
699
2,434
3,341
326
0
326
6,800
4
3,677
92
3,504
81
4,658
195
2,210
1,991
261
7,085
6,395
614
76
11,742
7,265
1,300
2,749
3,216
326
0
326
7,591
4
4,148
92
3,975
81
5,671
330
2,646
2,383
312
8,040
7,381
583
76
13,712
8,306
1,300
3,289
3,717
326
0
326
8,632
4
5,076
92
4,903
81
Cash Flows Statement
CFO
Net Income
Depreciation
Changes in Working Capital
Other Changes
CFI
Capex
Others
CFF
Changes in Debt
Dividend Payment
Adjustments and Others
Changes in Cash
Forex Effect
3,281
3,044
163
135
(61)
(700)
(629)
(71)
(2,436)
0
(2,442)
6
145
(9)
3,619
3,387
180
(63)
114
(1,310)
(1,273)
(37)
(2,848)
190
(3,044)
7
(538)
(2)
5,462
4,164
254
883
161
(1,433)
(1,420)
(13)
(4,011)
509
(4,532)
12
18
0
4,804
4,634
332
(163)
0
(1,382)
(1,414)
32
(3,563)
601
(4,164)
0
(141)
0
6,129
5,562
405
162
0
(1,360)
(1,391)
31
(4,634)
0
(4,634)
0
135
0
Ratio
Current Ratio
Cash Ratio
Quick Ratio
Gross Profit Margin
EBIT Profit Margin
Net Profit Margin
ROE
ROA
Sales Growth
EBIT Growth
Net Profit Growth
Capex/Previous Year Sales
100.4%
23.9%
59.0%
49.6%
23.1%
16.7%
82.2%
40.7%
17.1%
22.8%
26.5%
4.0%
85.1%
7.2%
42.8%
51.8%
23.1%
17.2%
83.7%
38.9%
7.9%
7.8%
11.3%
7.0%
68.7%
5.2%
37.3%
51.2%
23.2%
17.7%
113.3%
39.7%
19.2%
20.1%
22.9%
7.2%
64.1%
2.7%
33.1%
51.2%
23.7%
17.5%
111.7%
39.5%
13.0%
15.1%
11.3%
6.0%
68.3%
4.0%
35.8%
51.2%
23.7%
17.5%
109.6%
40.6%
19.7%
19.9%
20.0%
5.2%
Income Statement
Net Sales
COGS
Gross Profit
Total Operating Expenses
EBIT
Non-Operating Income
Pre-tax Income
Tax Expenses
Minority Interests
Net Income
7
Head Office
Chase Plaza, 12th Floor
Jl.Jend.Sudirman Kav 21, Jakarta 12920
Tel : +62-21 520 7374
Fax : +62-21 2598 9821
www.bps.co.id
Research Team
Andy Ferdinand
Senior Analyst
andy@bps.co.id
Parningotan Julio
Analyst
julio@bps.co.id
Yasmin Soulisa
Analyst
yasmin@bps.co.id
Wisnu Karto
Analyst
wisnu@bps.co.id
Hasan
Research Associate
hasan@bps.co.id
Rukan Grand Puri Niaga Jl. Puri Kencana Blok K6 No.2P
Palembang
Branches
Jakarta
Jakarta Barat 11610
Tel: +62 21 58351562
Bandung
Fax: +62 21 58351563
Tel : +62 711 375600
Jl.Jend Gatot Subroto No.47 C
Yogyakarta
Bandung 40262
Tel : +62 22 87340273
Medan
Fax : +62 22 87340274
Makassar
Semarang
Thamrin Square Blok C-12 Jl.Thamrin No.5 Semarang
Semarang 50244
Fax : +62 31 5689568
Jl.Kahuripan No.5
Tel : +62 24 3516161 Fax : +62 24 3518546
Solo
Malang 65119
Tel : +62 341 358889
Ruko Ruby I No.9 Jl. Boulevard Panakukang Mas
Tel : +62 411 430959 (hunting) 455038 (sales) Fax : +62 411 432376
Surabaya 60281
Malang
Fax : +62 274 544 800
Makassar 90222
Fax : +62 61 4523013
Ruko Darmo Square Blok B No.8 Jl.Raya Darmo 54-56
Tel : +62 31 5623445
Jl Magelang No 91
Tel : +62 274 580 299
Medan 20157
Surabaya
Fax : +62 711 376855
Yogyakarta 55242
Jl.Ir Djuanda No.16-J
Tel : +62 61 4562262
Jl.Rajawali No. 1174 D
Palembang 30113
Jl. Slamet Riyadi No.217
Tel : +62 71 662425 Fax : +62 71 662424
Fax : +62 341 353797
Batavia Prosperindo Sekuritas Investment Ratings: BUY – expected total return of 10% or more; HOLD – expected total return of -10% to 10%;
SELL – expected total return of -10% or less. Expected total return is defined as 12-month total return (including dividends).
DISCLAIMER
The information contained in this report has been taken from sources we deem reliable, however, PT. Batavia Prosperindo Sekuritas or its affiliates, cannot
guarantee its accuracy and completeness.
The views expressed in this report accurately reflect personal views of the analyst(s) about the subject securities or issuers and no part of the compensation of
the analyst(s) was, is, or will be directly or indirectly related to the inclusion of specific recommendations and/or views in this report. Nothing in this report
constitutes a representation that any investment strategy or recommendation contained herein is suitable or appropriate to a recipient’s individual circumstances.
This report is published solely for information purposes and should not be considered as a solicitation or an offer to buy or sell any securities.
Neither PT. Batavia Prosperindo Sekuritas nor any of its affiliates and/or employees accepts any liability for any direct or consequential losses arising from any use
of this publication. Copyright and database rights protection exists in this publication and it may not be reproduced, distributed and/or published by any person
for any purpose without prior consent of PT. Batavia Prosperindo Sekuritas. All rights are reserved.
Our report is also available at
Bloomberg, BPSJ <GO>
ISI Emerging Market, www.securities.com

