Exp. 3 Write-up
advertisement
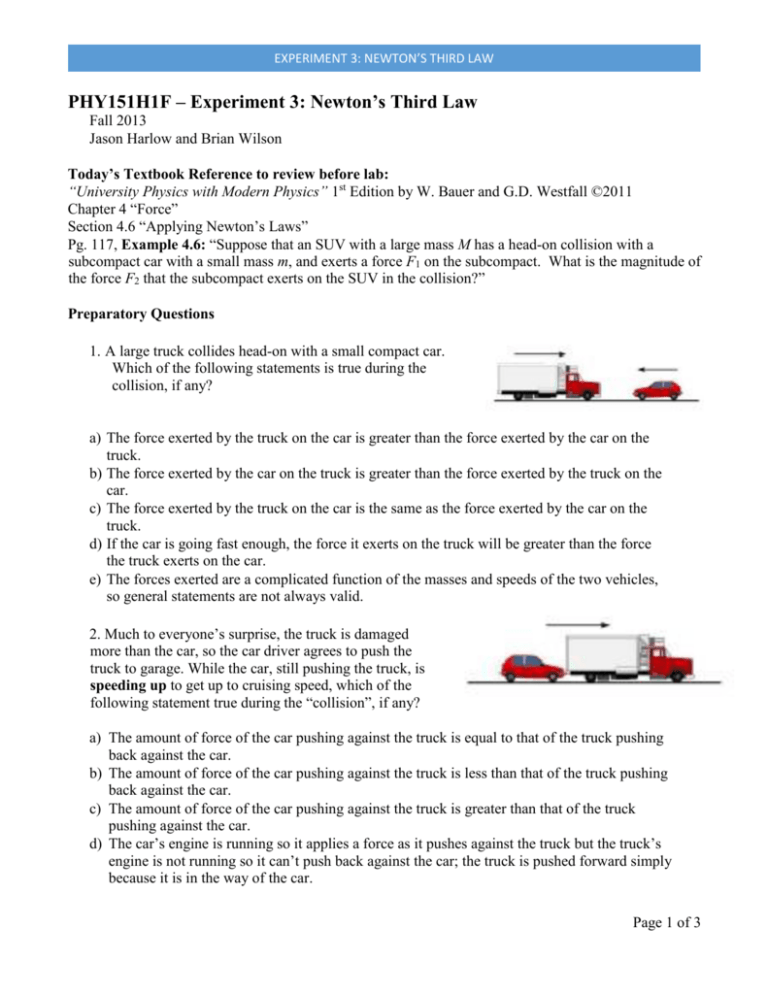
EXPERIMENT 3: NEWTON’S THIRD LAW PHY151H1F – Experiment 3: Newton’s Third Law Fall 2013 Jason Harlow and Brian Wilson Today’s Textbook Reference to review before lab: “University Physics with Modern Physics” 1st Edition by W. Bauer and G.D. Westfall ©2011 Chapter 4 “Force” Section 4.6 “Applying Newton’s Laws” Pg. 117, Example 4.6: “Suppose that an SUV with a large mass M has a head-on collision with a subcompact car with a small mass m, and exerts a force F1 on the subcompact. What is the magnitude of the force F2 that the subcompact exerts on the SUV in the collision?” Preparatory Questions 1. A large truck collides head-on with a small compact car. Which of the following statements is true during the collision, if any? a) The force exerted by the truck on the car is greater than the force exerted by the car on the truck. b) The force exerted by the car on the truck is greater than the force exerted by the truck on the car. c) The force exerted by the truck on the car is the same as the force exerted by the car on the truck. d) If the car is going fast enough, the force it exerts on the truck will be greater than the force the truck exerts on the car. e) The forces exerted are a complicated function of the masses and speeds of the two vehicles, so general statements are not always valid. 2. Much to everyone’s surprise, the truck is damaged more than the car, so the car driver agrees to push the truck to garage. While the car, still pushing the truck, is speeding up to get up to cruising speed, which of the following statement true during the “collision”, if any? a) The amount of force of the car pushing against the truck is equal to that of the truck pushing back against the car. b) The amount of force of the car pushing against the truck is less than that of the truck pushing back against the car. c) The amount of force of the car pushing against the truck is greater than that of the truck pushing against the car. d) The car’s engine is running so it applies a force as it pushes against the truck but the truck’s engine is not running so it can’t push back against the car; the truck is pushed forward simply because it is in the way of the car. Page 1 of 3 EXPERIMENT 3: NEWTON’S THIRD LAW e) Neither the car nor the truck exert any force on the other, the truck is pushed forward simply because it is in the way of the car. The Experiment Use the force sensors and the toy trucks provided to confirm (or disprove!) your answers to the Preparatory Questions. Make several runs, with different loadings of the trucks. Remember that for an isolated system you will not be touching the trucks during the collisions. Make sure that you describe clearly your procedures. Notes: • You may want to review Experiment 1 and how to use DataStudio. • To connect the sensors, click Setup and in the Experiment Setup window click on Add Sensor and in the Choose Sensor window double click on the force sensor icon. A force sensor will appear connected to channel A of the 750 Interface. Similarly connect another force sensor to channel B. Now connect the real force sensors to the Analog Channels A and B of the real 750 Interface. • Before taking readings, press the TARE button on the top of the Force Sensors in order to zero the reading. Very often this does not help and the Force Sensor indicates pressure on its surface in the absence of interaction. Think about how to account for this systematic error in interpretation of your results. • It is up to you to set an optimal sample rate; too slow and you will not collect enough information; too fast and processing problems may arise. To set the Sample Rate, click on either of the Force Sensors in the Experiment Setup window and adjust the Sample Rate. • At high sample rates data may be recorded faster than the computer can process it if there are graphs visible. Remove graphs and displays to rectify this (or reduce the sample rate). • When calculations are performed on data taken at high sample rates the computer response time may be slow. To speed things up, do one or more of the following. 1) Limit the total number of data points by taking data only for 5 seconds or less per run using the manual Start and Stop. 2) Limit the total number of data points by setting the Delay Start and Automatic Stop options so that triggering occurs when the force is larger or smaller than a predetermined value (Setup → Experiment Setup → Sampling Options → Delayed Start → click on Data Measurement). A trial run will tell you the approximate “predetermined value” to use. This procedure drastically reduces the file size if you wish to save your data. Analysis Quote values of the forces involved, and the mean of the difference between them. Use the calculator icon on the graph tool bar to create a formula for the difference D between the two forces. The prompts will ask you to define any variables in this formula. The variables will be Data Measurements which are Force, ChA/B. If a graph of D is not visible, drag the run number for D in the Data window onto the Graph icon in the Displays window. Zoom in on the portion of the graph where the two trucks are colliding. Using the Σ pull-down menu on Page 2 of 3 EXPERIMENT 3: NEWTON’S THIRD LAW the graph toolbar, you can obtain various statistics for any data you select; you will need Mean, Standard Deviation and total number of data points (Count). You will observe that D is not exactly zero for all points. Why not? Does this mean a deviation from Newton’s 3rd Law occurs at the non-zero points? To answer this question, and to quote a quantitative limit on how well you have confirmed the Third Law, proceed as follows: • Create a histogram by dragging the run number for D in the Data window onto the Histogram icon in the Displays window. Note that by selecting a portion of the D graph, the associated histogram will display information for that section only. • Use the Histogram Settings pull down menu to adjust the histogram and give the best display. Note the shape of this distribution. Does it appear to be approximately Gaussian (i.e. Normal)? If it were assumed that this distribution is a Gaussian distribution, what percentage of points would you expect to lie outside three standard deviations from the mean? Is this expectation confirmed for your data? Finally, if it appears from your data that the Mean value of D is not zero, (Question: what do you mean by ‘zero’? Give an experimental answer!), it is worth checking if this is simply a matter of inaccurate calibration or a more systematic effect. Take a few more measurements and discuss your conclusions, with numbers. Page 3 of 3
