Who would be affected by soda taxes?
advertisement
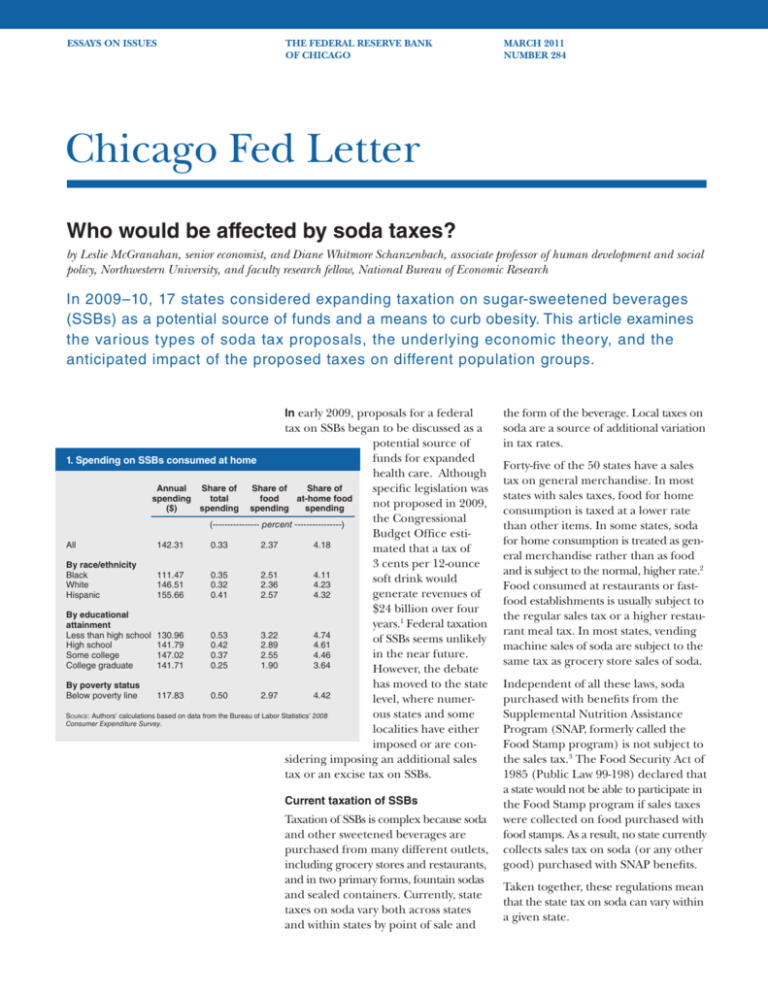
ESSAYS ON ISSUES THE FEDERAL RESERVE BANK OF CHICAGO MARCH 2011 NUMBER 284 Chicag­o Fed Letter Who would be affected by soda taxes? by Leslie McGranahan, senior economist, and Diane Whitmore Schanzenbach, associate professor of human development and social policy, Northwestern University, and faculty research fellow, National Bureau of Economic Research In 2009–10, 17 states considered expanding taxation on sugar-sweetened beverages (SSBs) as a potential source of funds and a means to curb obesity. This article examines the various types of soda tax proposals, the underlying economic theory, and the anticipated impact of the proposed taxes on different population groups. In early 2009, proposals for a federal tax on SSBs began to be discussed as a potential source of funds for expanded 1. Spending on SSBs consumed at home health care. Although Annual Share of Share of Share of specific legislation was spending total food at-home food not proposed in 2009, ($) spending spending spending the Congressional (---------------- percent ----------------) Budget Office estiAll 142.31 0.33 2.37 4.18 mated that a tax of 3 cents per 12-ounce By race/ethnicity Black 111.47 0.35 2.51 4.11 soft drink would White 146.51 0.32 2.36 4.23 generate revenues of Hispanic 155.66 0.41 2.57 4.32 $24 billion over four By educational years.1 Federal taxation attainment Less than high school 130.96 0.53 3.22 4.74 of SSBs seems unlikely High school 141.79 0.42 2.89 4.61 in the near future. Some college 147.02 0.37 2.55 4.46 College graduate 141.71 0.25 1.90 3.64 However, the debate has moved to the state By poverty status Below poverty line 117.83 0.50 2.97 4.42 level, where numerous states and some Source: Authors’ calculations based on data from the Bureau of Labor Statistics’ 2008 Consumer Expenditure Survey. localities have either imposed or are considering imposing an additional sales tax or an excise tax on SSBs. Current taxation of SSBs Taxation of SSBs is complex because soda and other sweetened beverages are purchased from many different outlets, including grocery stores and restaurants, and in two primary forms, fountain sodas and sealed containers. Currently, state taxes on soda vary both across states and within states by point of sale and the form of the beverage. Local taxes on soda are a source of additional variation in tax rates. Forty-five of the 50 states have a sales tax on general merchandise. In most states with sales taxes, food for home consumption is taxed at a lower rate than other items. In some states, soda for home consumption is treated as general merchandise rather than as food and is subject to the normal, higher rate.2 Food consumed at restaurants or fastfood establishments is usually subject to the regular sales tax or a higher restaurant meal tax. In most states, vending machine sales of soda are subject to the same tax as grocery store sales of soda. Independent of all these laws, soda purchased with benefits from the Supplemental Nutrition Assistance Program (SNAP, formerly called the Food Stamp program) is not subject to the sales tax.3 The Food Security Act of 1985 (Public Law 99-198) declared that a state would not be able to participate in the Food Stamp program if sales taxes were collected on food purchased with food stamps. As a result, no state currently collects sales tax on soda (or any other good) purchased with SNAP benefits. Taken together, these regulations mean that the state tax on soda can vary within a given state. 2. Calorie intake, by population group Total daily calories (SD) Calories from SSBs (SD) % calories from SSBs % (SD) All 2,115 (1,005) 121 (213) 5.6 (9.6) By race/ethnicity Black White Hispanic 2,085 2,142 2,104 (1,056) (998) (1,050) 123 124 129 (190) (227) (178) 6.2 5.6 6.0 (9.8) (9.8) (8.1) By educational attainment Less than high school High school Some college College graduate 1,958 2,110 2,157 2,161 (1,048) (1,182) (970) (866) 137 159 131 78 (211) (252) (216) (163) 7.4 7.3 5.8 3.3 (11.4) (11.3) (9.4) (6.2) By poverty status Below poverty line 1,994 (1,195) 180 (279) 9.0 (13.3) Note: SD indicates standard deviation. Source: Authors’ calculations based on data from the 2007–08 National Health and Nutrition Examination Survey (NHANES). According to data from the Rudd Center for Food Policy and Obesity at Yale University, 17 states filed legislation in 2009–10 to expand soda taxation; two of those states, Colorado and Washington, passed such legislation. With a new legislative session beginning in 2011, states may again begin to expand the taxation of soda. There are two primary forms of increased taxation. In some states, proposals would subject soft drinks to the general sales tax and no longer treat them as food items. This type of proposal was enacted in Colorado. The second type of proposal would create an excise tax on distributors of soft drinks. This was enacted in Washington State, where bottlers needed to pay a $0.02 tax per 12 ounces of soda. This legislation was subsequently repealed. Economics of soda taxation In general, taxes distort market functioning and reduce economic efficiency. Proponents of soda taxation argue that it falls into the realm of a “Pigovian tax.” Such a tax may actually increase total economic efficiency in the presence of externalities from consumption. In other words, if there is a negative effect from consumption of a particular good that is not directly felt by consumers, then when left to their own devices, consumers will consume more of the good than is socially optimal. Therefore, taxing such a good will not only raise revenue for the government, but may also improve overall social welfare by reducing “overconsumption” of the good. In the case of the soda tax, reducing consumption may reduce average body weight and obesity rates. This, in turn, might reduce health problems related to obesity, such as diabetes and heart disease, and could reduce health care expenditures.4 Public finance theory argues that it usually does not matter whether a tax is imposed on the producers or consumers of a good, because the producers can pass some of the tax on to the consumers. The incidence of the tax burden is shared depending on the elasticity of demand and supply, regardless of whether producers or consumers directly remit the tax. However, in the case of the soda tax, there are important differences between the excise tax (paid by suppliers) and sales tax (paid by consumers and remitted by retailers) proposals. Specifically, sales taxes are ad valorem—in proportion to the good’s price. In contrast, the excise tax proposals have been based on volume, with a tax either per ounce of soda or per teaspoon of added sugar. Soda prices tend to be lower on a per ounce basis for larger containers (such as two-liter bottles or 12-packs) than for individual cans or single-serve bottles or for generics. As a result, if an ad valorem tax is levied, then the tax per ounce of beverage will be lower for larger servings and generic brands, and consumers may switch to these cheaper options. Some excise tax proposals would levy taxes per ounce. This would not give consumers an incentive to switch to larger containers, but it might encourage consumers to switch to brands with a higher sugar content. Other excise tax proposals would levy taxes based directly on sugar content. Excise taxes also would lead to increased prices of fountain and restaurant beverages, because increased excise taxes would apply to beverages before they are shipped to restaurants. If states expanded soda taxation by adding grocery purchases of soda to the tax base, however, it would not affect restaurant prices, as restaurant purchases are already subject to the sales tax. Finally, the intersection of proposed soda taxes and SNAP benefits depends on the form of the tax. An increased sales tax on soda would not apply to these purchases. On the other hand, excise taxes that are levied earlier in the production process would be passed on to SNAP recipients in the same way that they are passed on to other consumers—by being incorporated into the list price of the drink. Impact on different population groups An increase in soda taxes would affect people differently, depending on how much soda they purchase, where they buy it, whether they purchase it with SNAP benefits, and the form of the tax. In figure 1, we calculate average annual spending on SSBs consumed at home (at-home SSBs) for members of various demographic groups, based on data from the Bureau of Labor Statistics’ 2008 Consumer Expenditure Survey (CEX). We also present at-home SSB spending as a share of total spending, as a share of total food spending, and as a share of total spending on food consumed at home. The CEX is the most comprehensive survey of household expenditure patterns in the United States. The survey provides detailed information on drinks purchased for consumption at home and more limited data on drinks purchased away from home.5 We present data on the sum of spending on carbonated drinks, fruit-flavored noncarbonated drinks, and sports drinks. While diet drinks would not be subject to additional taxation under some proposals, carbonated drinks are not separated by calorie content in the data. In figure 1, we show that the average household spent $142 on sugar-sweetened beverages at home in 2008.6 Among the eight subpopulations in the data, only Hispanics exceeded average spending by more than $10, while three groups spent over $10 less—blacks, those with less than a high school education, and the poor. The next three columns of figure 1 show spending on SSBs as a proportion of total spending (column 2), total food spending (column 3), and total spending on food at home (column 4). Sugar-sweetened beverage consumption as a share of total spending falls as educational attainment increases. The same pattern is found for SSB spending as a share of food spending and at-home food spending. We also observe that SSBs represent a larger share of the spending of the poor than is true for the overall population. As a result, a soda tax would likely have a disproportionate effect on the less educated and poor groups; these groups are also more likely to benefit from the SNAP program. We have shown that SSBs comprise a non-trivial share of food spending. In figure 2, we provide data on the role SSBs play in individuals’ diets. The data here come from the 2007–08 wave of the National Health and Nutrition Examination Survey (NHANES),7 and the sample is limited to adults aged 20 or older. Calorie consumption is collected using 24-hour recall interviews, and we use the first day’s dietary recall for those that report multiple days of data. The NHANES series of studies is the largest national data source on caloric intake. We construct the measure of SSBs by combining reported intake of sugared sodas, sweetened teas, and energy drinks. Overall, as shown in figure 2, adults on average report consuming 121 calories per day from SSBs. The standard deviation of calories from SSBs is large, indicating that there is substantial variation across individuals in intake. On average, SSBs account for 5.6% of total reported calorie intake. Average SSB consumption varies only slightly by race/ethnic group, but varies much more widely by educational attainment.8 Individuals in households with a high school diploma or less get over twice the proportion of their daily calories from SSBs than those in college graduate households. Similarly, the poor get a larger share of their daily calories from SSBs. Across all groups, the average share of calories from SSBs is greater than the average share of food spending on SSBs (shown in figure 1), indicating that SSBs are a relatively inexpensive source of calories.9 Potential impact on public health A recent study of the effects of current soda taxes on obesity finds that higher taxes do not reduce obesity rates.10 Recent proposals, however, suggest raising the tax rates to levels much higher than those that are currently seen and may, therefore, lead to a different outcome. Two conditions would need to be met in order for an expanded soda tax to affect the rates of overweight and obesity. First, increased taxation would need to lead to reduced consumption of soda. Recent research suggests that soda consumption is modestly responsive to price changes. According to a recent study by Andreyeva, Long, and Brownell, an increase in soda price of 10% would decrease consumption by somewhere between 2.7% and 8.1%.11 Second, lower soda consumption would need to result in a reduction in overall caloric consumption. There are many possible responses to increased soda taxes. Consumers might purchase soda that has more sugar or calories per ounce. They might also respond by consuming other drinks that are not subject to the tax or shifting their consumption to other items. A recent study that estimated the impact of a 40% tax on all SSBs found that the tax would reduce an individual’s calories from SSBs by about 17 kcal per day and calories from consumption of all beverages by 12 kcal per day.12 The study found that some of the drop in SSB consumption is offset by a higher intake of calories from other beverages, but the authors do not investigate the effects of SSB taxation on consumption of food. The effects on food consumption and, hence, the effects on total calories, depend on whether calories from food and drinks are substitutes or complements. In addition, because elasticity of demand varies with consumer preferences, it is possible that the tax response will differ systematically based on consumers’ obesity status. Conclusion In this article, we have documented consumption patterns for SSBs, in terms of both expenditure and caloric intake. In general, less educated and poorer population groups concentrate a higher proportion of their total spending on SSBs and get a larger fraction of their daily caloric intake from these relatively inexpensive sources. In the absence of substantial differences in the elasticity of demand across groups, this implies that increased soda taxation would primarily affect these disadvantaged groups. However, the impact will vary somewhat, depending on the particular form of the tax and whether purchases are made using SNAP benefits. 1 Congressional Budget Office, 2008, Budget Options Volume 1: Health Care, December, available at www.cbo.gov/ftpdocs/99xx/ doc9925/12-18-HealthOptions.pdf. 2 See Chicago Fed Letter, No. 284, Supplemental Figure, “Soda taxes in 2009,” available at www.chicagofed.org/webpages/people/ mcgranahan_leslie.cfm#, under Other Resources. Charles L. Evans, President ; Daniel G. Sullivan, Executive Vice President and Director of Research; Spencer Krane, Senior Vice President and Economic Advisor ; David Marshall, Senior Vice President, financial markets group ; Daniel Aaronson, Vice President, microeconomic policy research; Jonas D. M. Fisher, Vice President, macroeconomic policy research; Richard Heckinger, Assistant Vice President, markets team; Anna Paulson, Vice President, finance team; William A. Testa, Vice President, regional programs, and Economics Editor ; Helen O’D. Koshy and Han Y. Choi, Editors ; Rita Molloy and Julia Baker, Production Editors ; Sheila A. Mangler, Editorial Assistant. Chicago Fed Letter is published by the Economic Research Department of the Federal Reserve Bank of Chicago. The views expressed are the authors’ and do not necessarily reflect the views of the Federal Reserve Bank of Chicago or the Federal Reserve System. © 2011 Federal Reserve Bank of Chicago Chicago Fed Letter articles may be reproduced in whole or in part, provided the articles are not reproduced or distributed for commercial gain and provided the source is appropriately credited. Prior written permission must be obtained for any other reproduction, distribution, republication, or creation of derivative works of Chicago Fed Letter articles. To request permission, please contact Helen Koshy, senior editor, at 312-322-5830 or email Helen.Koshy@chi.frb.org. Chicago Fed Letter and other Bank publications are available at www.chicagofed.org. ISSN 0895-0164 3 Note that food stamp benefits may not be used to purchase food or beverages at restaurants or fast-food establishments. For consistency with the CEX data, here the 8 household’s education level is defined as the maximum of the household head and spouse’s reported educational attainment. Congressional Budget Office, op. cit., p. 192. 4 5 6 We do not present data on food consumed away from home, because these data are presented as totals at a meal and do not separate out the items in the meal, with the exception of alcoholic beverages. The NHANES data include food consumed 9 away from home, while the CEX only covers food consumed at home, but this is unlikely to explain this discrepancy. Our results are generally in line with those of Cynthia Ogden, Molly Lamb, Margaret Carroll, and Katherine Flegal, 2010, “Obesity and socioeconomic status in adults: United States, 2005–08,” NCHS Data Brief, No. 50, December. The CEX unit of analysis is a “consumer unit” and is similar to a household. NHANES is a major program of the National 7 Center for Health Statistics (NCHS). NCHS is part of the Centers for Disease Control and Prevention (CDC) and has the responsibility for producing vital and health statistics for the nation. Jason M. Fletcher, David E. Frisvold, and 10 Nathan Tefft, 2010, “Can soft drink taxes reduce population weight?,” Contemporary Economic Policy, Vol. 28, No. 1, January, pp. 23–35. 11Tatiana Andreyeva, Michael W. Long, and Kelly D. Brownell, 2010, “The impact of food prices on consumption: A systematic review of research on the price elasticity of demand for food,” American Journal of Public Health, February, pp. 216–222. 12 Eric A. Finkelstein, Chen Zhen, James Nonnemaker, and Jessica E. Todd, 2010, “Impact of targeted beverage taxes on higherand lower-income households,” Archives of Internal Medicine, Vol. 170, No. 22, December, pp. 2028–2034. Similar results are found in Travis A. Smith, Biing-Hwan Lin, and Jonq-Ying Lee, 2010, Taxing Caloric Sweetened Beverages: Potential Effects on Beverage Consumption, Calorie Intake, and Obesity, ERR-100, U.S. Department of Agriculture, Economic Research Service, July.

