Understanding and Improving Wafer Fab Cycle
Times
By Jennifer K. Robinson, FabTime Inc.
Introduction
There are many good reasons to improve wafer fab cycle time. Lower cycle times allow for faster
product development cycles, and speedier time to market for new products. Lower cycle times also
allow companies to maintain lower inventory levels, and to better satisfy customers. Some studies
have shown a correlation between reduced cycle times and improved line yield (a clear dollar benefit).
All in all, improving cycle times can improve both customer satisfaction and the semiconductor
manufacturer’s bottom line.
The first step to improving cycle times is to understand the factors that make wafer fab cycle times
high in the first place. In this article, we will first discuss contributors to wafer fab cycle times, and
then propose some suggestions for making low-cost improvements.
What Makes Fab Cycle Times High?
Cycle time is the total time required to produce a lot or wafer, from entering the fab to leaving the
fab. Cycle time includes time spent processing, as well as transport time and time spent waiting in
queue. In most fabs, queue time makes up the bulk of total cycle time – a wafer spends anywhere
from 50% to 90% of its time in the fab waiting. This includes time spent waiting for tools and time
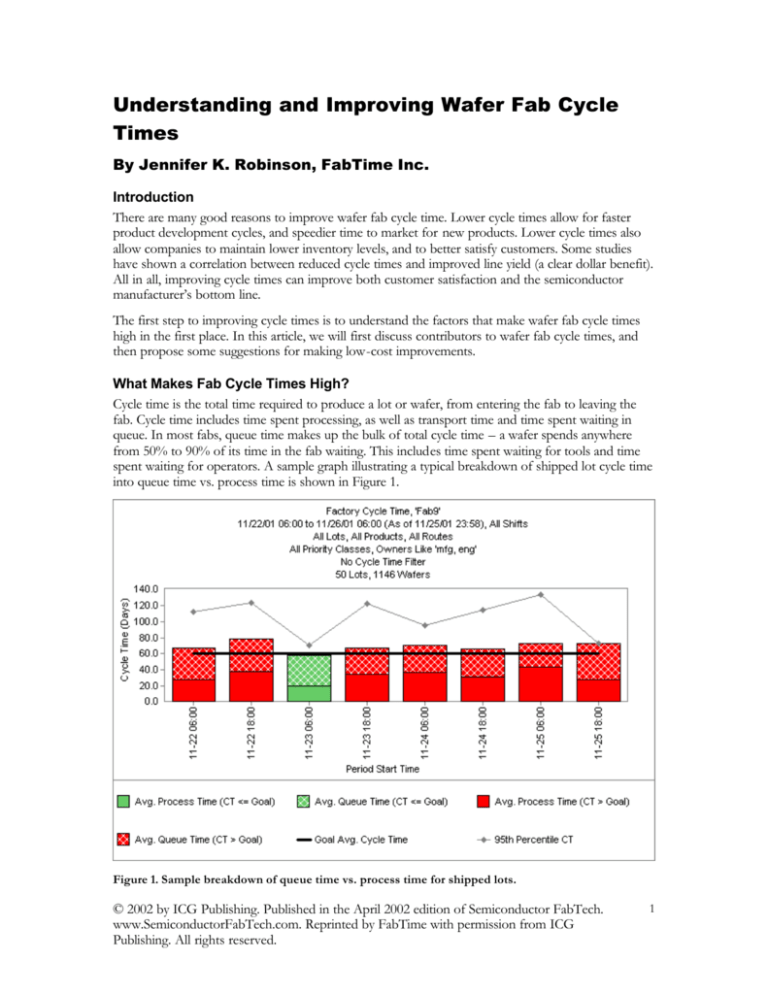
spent waiting for operators. A sample graph illustrating a typical breakdown of shipped lot cycle time
into queue time vs. process time is shown in Figure 1.
Figure 1. Sample breakdown of queue time vs. process time for shipped lots.
© 2002 by ICG Publishing. Published in the April 2002 edition of Semiconductor FabTech.
www.SemiconductorFabTech.com. Reprinted by FabTime with permission from ICG
Publishing. All rights reserved.
1
As indicated in the figure, even when average values for cycle time are relatively close to the goal,
some lots can have much higher cycle times (as seen in the 95th percentile cycle time line on the
graph).
Overall cycle time for a lot is the sum of the time that the lot spends at each operation, plus transport
time. Cycle time at each operation is primarily a function of three components: equipment loading,
variability, and number of tools in the relevant toolgroup. There is a mathematical underpinning to
this. The Pollaczek-Khintchine (or P-K) formula, for example, gives the expected average work-inprocess (WIP) at a single-tool workstation where arrivals to the workstation are highly variable, and
process times are somewhat less variable (as in a wafer fab). For tools that fit this description, the
expected WIP can be easily computed from the average time between arrivals, the average process
time, and the variance of the process time distribution. Extensions are then possible to account for
workstations with more than one tool. (For more detail on the use of the P-K formula, see Hopp and
Spearman.)
The bottom line illustrated by the P-K formula is that in the presence of any variability at all, cycle
time increases with equipment loading. The more variability that is present, the more cycle time will
increase, with the highest cycle times corresponding to the highest levels of equipment loading. This
is illustrated in Figure 2, which shows cycle time vs. equipment loading for a single tool with failures.
In the low variability environment, cycle time starts to increase significantly when equipment loading
is above 90% of the maximum loading (maximum loading is the equipment loading that would result
in no idle time). For higher variability systems, the cycle time starts to increase at even lower
equipment loading values.
Cycle Time vs. Loading Curves for Different Levels of Variability
Average Cycle Time / Raw Process
Time
30
25
20
15
10
5
0
50%
55%
60%
65%
70%
75%
80%
85%
90%
95%
Equipment Loading
Low Variability
Medium Variability
High Variability
Figure 2. Cycle time vs equipment loading for different levels of variability
© 2002 by ICG Publishing. Published in the April 2002 edition of Semiconductor FabTech.
www.SemiconductorFabTech.com. Reprinted by FabTime with permission from ICG
Publishing. All rights reserved.
2
To understand intuitively why this is true, consider a local road system during rush hour. When
traffic volumes are high, even the slightest disturbance (e.g. some driver suddenly remembering to
change lanes) requires everyone on the road to slow down. Travel time to work almost always takes
longer during rush hour (when the roadway system is highly loaded) than it does in the middle of the
day (when loadings are low). It’s the same way in a fab, except that rush hour can last for months at a
time.
Consider now what happens on a single-lane road during rush hour. Any driver who slows down
causes every driver behind him to slow down. This is why number of tools in each toolgroup is the
third contributor to cycle time by operation. One-of-a-kind tools, like single lane roads, cause
everything to come to a halt when they have a problem. If given a choice between two slow tools and
one fast tool, with the same total throughput for each choice, the two slow tools may be a better bet
for keeping down cycle times. This is because if one of the two slow tools goes down for
maintenance, the other one can still be operating. If the fast tool goes down, it can stop the whole
fab.
What Factors Contribute to Wafer Fab Variability (and Cycle Time)?
In a situation with no variability, a fab manager could operate all of the equipment at very high
loadings, without seeing cycle times increase. The fab could also safely purchase one-of-a-kind tools,
because these tools would never go down, so no backup would be needed. Equipment loading and
number of tools per toolgroup are a problem for cycle time because of the presence of variability.
And a wafer fab, of course, is an environment chock-full of variability. Some of the sources of
variability in a fab are listed in Figure 3.
Sources of Wafer Fab Variability
Batch processing
Dispatch rules (especially in regards to batch
tools and tools with setup time)
Batching for transport between operations
Lot release patterns
Unreliable equipment (random failures and
preventive maintenance events)
Operator and technician unavailability
(especially during shift change)
Product/process mix
Variation in operator and technician skills /
training
Rework
Engineering lots
Scrap
Hot lots
Monitor wafers
Holds
Setup
Tool dedication
Reentrant flow
Figure 3. Sources of variability in a wafer fab
© 2002 by ICG Publishing. Published in the April 2002 edition of Semiconductor FabTech.
www.SemiconductorFabTech.com. Reprinted by FabTime with permission from ICG
Publishing. All rights reserved.
3
How Can Cycle Times be Improved?
The easiest way to improve cycle time is to reduce equipment loading. Many fabs have seen this
behavior during the current downturn. When starts go down, cycle times tend to go down. This is
not, of course, a helpful long-term solution. Running a fab with very low equipment loading is too
expensive to be profitable in most markets. However, if you are concerned about cycle times for your
fab, it may make sense to plan for lower equipment loadings for your less expensive tool groups, and
also to avoid one-of-a-kind tool groups.
A less expensive way to improve fab cycle times is to reduce variability. The first step is to
understand which operations are contributing the most to cycle time, so that you can decide where to
focus improvement efforts. For example, Figure 4 shows the cycle time by operation for a single lot
(as an example – this is not actual data). Operation 1200 clearly stands out in this example, with more
than 30 hours of queue time, where all of the other operations show much lower queue times.
Figure 4. Cycle time by operation for a single lot, broken down into queue time vs. process time.
Figure 5 shows the average cycle time by operation for all operations completed within a 24-hour
period. Here Operation 3150 stands out as having by far the longest cycle time, and having that cycle
time consist mainly of queue time. There are, of course, many other metrics that can be used to
identify areas for improvement. The point is to use actual fab data to pinpoint the problems, and
then work to improve them.
© 2002 by ICG Publishing. Published in the April 2002 edition of Semiconductor FabTech.
www.SemiconductorFabTech.com. Reprinted by FabTime with permission from ICG
Publishing. All rights reserved.
4
Figure 5. Average cycle time by operation for all operations completed during a 24-hour period,
broken out into queue time vs. process time, and compared to the goal for each operation.
Here are a few general suggestions for reducing variability and improving cycle times without making
capital purchases (see Robinson and Chance, 2000 for more detail):
•
•
•
•
•
•
•
•
•
•
Eliminate large minimum batch size requirements for all but very highly loaded tools
(eliminate unnecessary waiting to form batches).
Explore batching rules, to make sure that all lots that can be batched together are batched
together (eliminate unnecessary waiting to form batches)
Cross-train equipment maintenance personnel, to reduce long delays waiting for the right
repair person.
Cross-train regular operators to handle more types of equipment, and to balance schedules.
Change preventive maintenance schedules to minimize variability.
Modify setup avoidance policies to ensure that low-volume products are not excessively
delayed.
Reduce transfer lot batch sizes.
Modify lot release policies to smooth flow through the early steps of the process (lower
variability).
Explore process changes to eliminate operations that can only be done on a single piece of
equipment (to reduce tool dedication dedication).
Check batching and setup assumptions for rework wafers. The entire parent lot is usually
delayed whenever the rework wafers are waiting for processing. Also make sure all
operations within the rework loop are necessary.
© 2002 by ICG Publishing. Published in the April 2002 edition of Semiconductor FabTech.
www.SemiconductorFabTech.com. Reprinted by FabTime with permission from ICG
Publishing. All rights reserved.
5
Conclusions
Wafer fab cycle time is a function of equipment loading, variability, and number of tools in each
toolgroup. These factors interact, and in particular, variability magnifies the effects of both high
equipment loading and one-of-a-kind tools. A relatively expensive way to improve cycle time is to
reduce equipment loading, either by purchasing additional tools or by reducing starts. A less
expensive solution is to identify problem operations and tools, and then work to lower variability in
those areas.
References
W. J. Hopp and M. L. Spearman. Factory Physics, McGraw-Hill, 2000.
J. K. Robinson and F. Chance, “Wafer Fab Cycle Time Management Using MES Data,” Proceedings
of the 2000 Modeling and Analysis for Semiconductor Manufacturing Conference (MASM 2000).
Tempe, AZ, May 10-12, 2000.
Author Biography
Jennifer Robinson is co-founder and chief operating officer of FabTime Inc., a provider of wafer fab
cycle time management software. She is also the editor of the FabTime Cycle Time Management
newsletter, a monthly email publication dedicated to wafer fab cycle time improvement. Previously,
she worked as a productivity improvement consultant in semiconductor manufacturing. Her clients
in that industry have included AMD, Headway Technologies, SEMATECH, Digital Equipment
Corporation, Seagate Technology, and Siemens AG. Jennifer holds a B.S. degree in civil engineering
from Duke University, an M.S. degree in Operations Research from the University of Texas at
Austin, and a Ph.D. degree in Industrial Engineering from the University of Massachusetts at
Amherst.
Follow-Up Information
Jennifer Robinson
FabTime Inc.
325M Sharon Park Drive #219
Menlo Park, CA 94025
Phone: 408-549-9932
Fax: 408-549-9941
www.FabTime.com
© 2002 by ICG Publishing. Published in the April 2002 edition of Semiconductor FabTech.
www.SemiconductorFabTech.com. Reprinted by FabTime with permission from ICG
Publishing. All rights reserved.
6


