Conditional Probability Worksheet 4
Runn Foot Base
Socc Total
ing (R) ball (F) Ball (B) er (S)
Pajamas Non- Total
Pajamas
Table -1
Cats
15
13
28
Mario
(M)
25
22
19
16
82
Dogs
22
17
39
Zelda
(Z)
24
16
23
14
77
Total
37
30
67
Total
49
38
42
30
159
Table -2
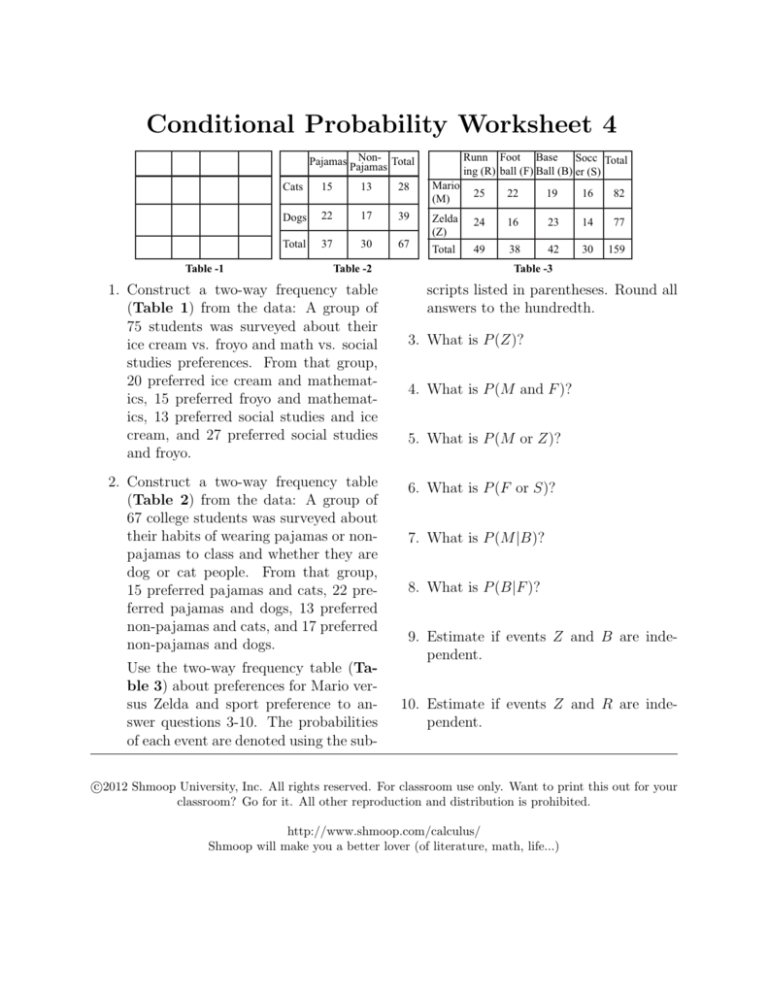
1. Construct a two-way frequency table
(Table 1) from the data: A group of
75 students was surveyed about their
ice cream vs. froyo and math vs. social
studies preferences. From that group,
20 preferred ice cream and mathematics, 15 preferred froyo and mathematics, 13 preferred social studies and ice
cream, and 27 preferred social studies
and froyo.
2. Construct a two-way frequency table
(Table 2) from the data: A group of
67 college students was surveyed about
their habits of wearing pajamas or nonpajamas to class and whether they are
dog or cat people. From that group,
15 preferred pajamas and cats, 22 preferred pajamas and dogs, 13 preferred
non-pajamas and cats, and 17 preferred
non-pajamas and dogs.
Use the two-way frequency table (Table 3) about preferences for Mario versus Zelda and sport preference to answer questions 3-10. The probabilities
of each event are denoted using the sub-
Table -3
scripts listed in parentheses. Round all
answers to the hundredth.
3. What is P (Z)?
4. What is P (M and F )?
5. What is P (M or Z)?
6. What is P (F or S)?
7. What is P (M |B)?
8. What is P (B|F )?
9. Estimate if events Z and B are independent.
10. Estimate if events Z and R are independent.
c
2012
Shmoop University, Inc. All rights reserved. For classroom use only. Want to print this out for your
classroom? Go for it. All other reproduction and distribution is prohibited.
http://www.shmoop.com/calculus/
Shmoop will make you a better lover (of literature, math, life...)


