Chapter 2: Psychology's Scientific Methods
advertisement
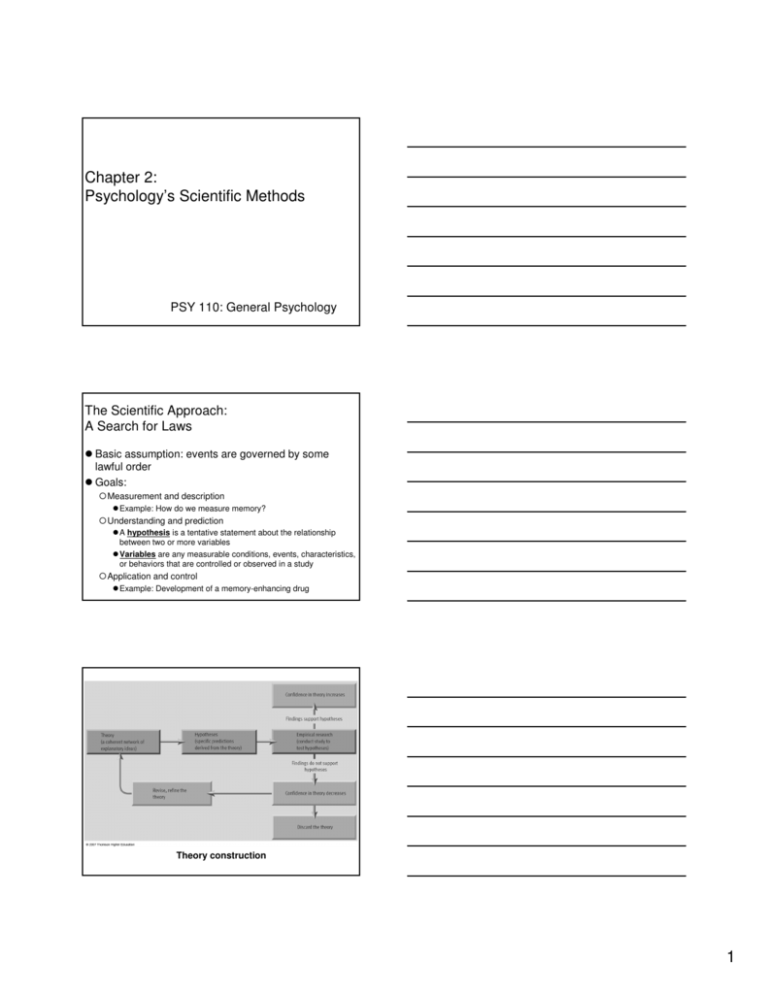
Chapter 2: Psychology’s Scientific Methods PSY 110: General Psychology The Scientific Approach: A Search for Laws Basic assumption: events are governed by some lawful order Goals: Measurement and description Example: How do we measure memory? Understanding and prediction A hypothesis is a tentative statement about the relationship between two or more variables Variables are any measurable conditions, events, characteristics, or behaviors that are controlled or observed in a study Application and control Example: Development of a memory-enhancing drug Theory construction 1 Five Steps in the Scientific Method Observing some phenomenon Some people are more aggressive than others Formulating hypotheses and predictions Watching violent TV will lead to aggressive behavior Testing through empirical research Some children will watch violent TV for 2 hours and others will watch non-violent TV for 2 hours, then engage in a task where aggression is possible Drawing conclusions Was the violent TV group more aggressive? Evaluating conclusions Publish results or present at a conference Consider additional research questions derived from current study The Scientific Method: Terminology Operational definitions are used to clarify precisely what is meant by each variable Participants or subjects are the organisms whose behavior is systematically observed in a study Data collection techniques allow for empirical observation and measurement Statistics are used to analyze data and decide whether hypotheses were supported The Scientific Method: Terminology Findings are shared through reports at scientific meetings and in scientific journals – periodicals that publish technical and scholarly material Advantages of the scientific method: clarity of communication and relative intolerance of error Research methods: general strategies for conducting scientific studies 2 Most Commonly Used Research Methods: How to Study Dreams? Experimental Research: Looking for Causes An experiment manipulates one variable under controlled conditions so that resulting changes in another variable can be observed Detection of cause-and-effect relationships Independent variable (IV): variable manipulated Dependent variable (DV): variable affected by manipulation (we just observe or measure this variable) How does X affect Y? X = Independent Variable Y = Dependent Variable Recognize the IV and the DV Example 1: A researcher is interested in how heart rate and blood pressure are affected by viewing a violent film sequence as opposed to a nonviolent film sequence Example 2: A social psychologist investigates the impact of group size on participants’ conformity in response to group pressure 3 Experimental and Control Groups: The Logic of the Scientific Method The experimental group consists of the participants who receive some special treatment in regard to the independent variable The control group consists of similar participants who do not receive the special treatment given to the experimental group Experimental and Control Groups: The Logic of the Scientific Method Random assignment of participants occurs when all participants have an equal chance of being assigned to any group or condition in the study Manipulate independent variable for only one group (i.e., the experimental group) Resulting differences in the two groups is most likely due to the independent variable Experimental and Control Groups: The Logic of the Scientific Method Extraneous variables are any variables other than the IV that seem likely to influence the DV in a specific study A confounding of variables occurs when two variables are linked together in a way that makes it difficult to sort out their specific effects 4 The basic elements of an experiment Experimental Designs: Variations Expose a single group to two different conditions Reduces extraneous variables Use more than one dependent variable Obtains a more complete picture of the effect of the independent variable Manipulate more than one independent variable Allows for study of interactions between variables Manipulation of two IVs in an experiment 5 Strengths and Weaknesses of Experimental Research Strengths: Conclusions about cause-and-effect can be drawn Weaknesses: Artificial nature of experiments Ethical and practical issues Descriptive/Correlational Methods: Looking for Relationships Methods used when a researcher cannot manipulate the variables being studied due to ethical or practical reasons In naturalistic observation a researcher engages in careful observation of behavior without intervening directly with the participants A case study is an in-depth investigation of an individual participant Example: Freud’s case study of “Dora” Survey research uses questionnaires or interviews to gather information about specific aspects of participants’ background or behavior Descriptive/Correlational Methods: Looking for Relationships Strengths: Allow researchers to describe patterns of behavior and discover links or associations between variables Broadens the scope of phenomena that psychologists are able to study Weaknesses: Cannot imply causation 6 Statistics and Research: Drawing Conclusions Statistics is the use of mathematics to organize, summarize, and interpret numerical data Descriptive statistics: organizing and summarizing data Inferential statistics: interpreting data and drawing conclusions Descriptive Statistics: Measures of Central Tendency Measures of central tendency describe or define the “typical” or “average” score in a distribution Mean is the arithmetic average of scores Median is the score falling in the exact center Mode is the most frequently occurring score Which most accurately depicts the “typical score”? Depends on what you want to know AND the type of data Example: 84 86 88 96 96 Mean is 90 Median is 88 Mode is 96 Descriptive Statistics: Variability Variability refers to how much the scores in a data set vary from each other and from the mean Standard deviation is an index of the amount of variability in a set of data High variability in data set = high standard deviation Low variability in data set = low standard deviation 7 Body Weight (pounds) Group 1 Group 2 150 150 225 155 100 145 115 140 90 160 250 150 260 170 125 130 90 155 95 150 68.56 145 Mean Standard Deviation 150 11.06 Descriptive Statistics: Correlation A correlation exists when two variables are related to each other A correlation coefficient is a numerical index of the degree of linear relationship between two variables Correlation coefficient is expressed as a number between -1 and +1 Can be positive or negative Numbers closer to 1 (+ or -) indicate stronger relationship Positive and negative correlation 8 Interpreting correlation coefficients Correlation: Prediction, Not Causation Higher correlation coefficients lead to an increased ability to predict one variable based on the other SAT/ACT scores are moderately correlated with first year college GPA (approximately +.50) 2 variables may be highly correlated but their causal relationship may remain unclear Example: Murder rates and ice cream sales are positively correlated Understanding Correlations Murder rates Ice cream sales 9 Inferential Statistics: Interpreting Data and Drawing Conclusions Inferential statistics are used to interpret data and draw conclusions That is, inferential statistics allow us to test hypotheses Hypothesis testing: Do observed findings support the hypotheses? Are findings real or due to chance? Statistical significance is said to exist when the probability that the observed findings are due to chance is very low Very low = less than 5 chances in 100 (.05 level) Evaluating Research: Methodological Pitfalls A sample is the collection of participants selected for observation in an empirical study The population is the much larger collection of individuals from which the sample is drawn Researchers use the sample in order to make generalizations about the population Sampling bias exists when a sample is not representative of the population from which it is drawn Random sampling refers to giving every member of the population an equal chance of being selected The relationship between the population and the sample 10 Evaluating Research: Methodological Pitfalls Placebo effects occur when participants’ expectations lead them to experience some change even though they receive ineffectual treatment Distortions in self-report data: Social desirability bias is the tendency to give socially approved answers to questions about oneself A response set is a tendency to respond to questions in a particular way that is unrelated to the content of the questions Evaluating Research: Methodological Pitfalls Experimenter bias occurs when a researcher’s expectations or preferences about the outcome of a study influence the results obtained the double-blind procedure is a research strategy in which neither participants nor experimenters know which participants are in the experimental or control groups Ethics in Psychological Research: Do the Ends Justify the Means? The question of deception The question of animal research Controversy among psychologists and the public Ethical standards for research: the American Psychological Association Ensures both human and animal subjects are treated with dignity 11
