y diAGRAM - The Learning Curve
advertisement
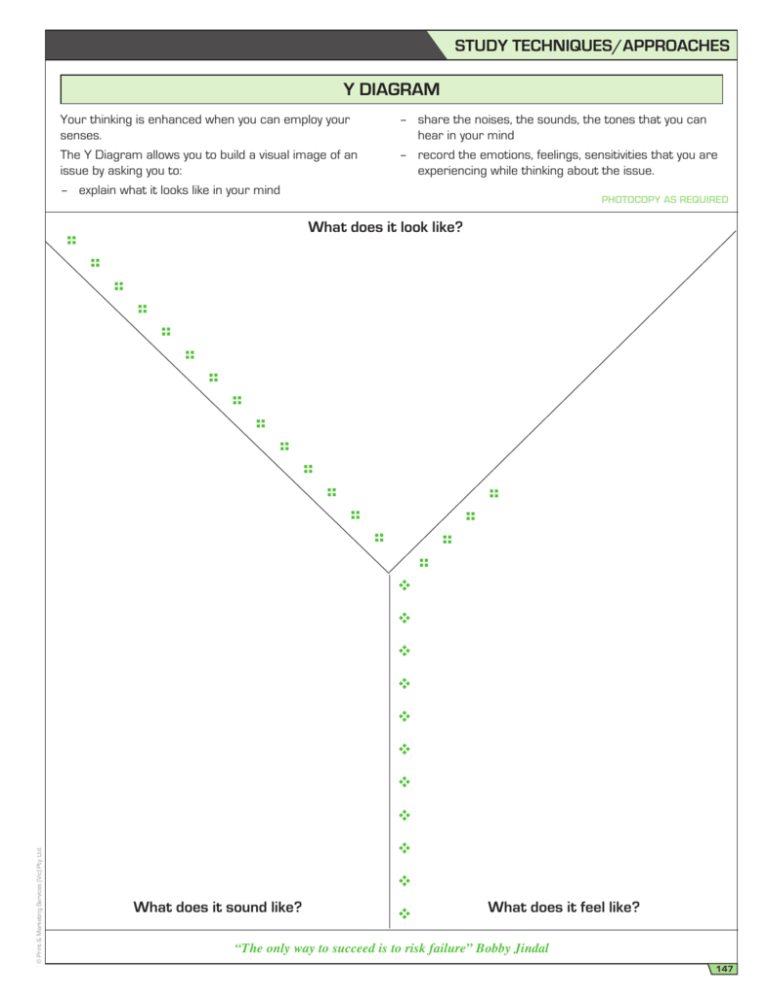
study techniques/APPROACHES Y DIAGRAM Your thinking is enhanced when you can employ your senses. The Y Diagram allows you to build a visual image of an issue by asking you to: – explain what it looks like in your mind – share the noises, the sounds, the tones that you can hear in your mind – record the emotions, feelings, sensitivities that you are experiencing while thinking about the issue. PHOTOCOPY AS REQUIRED v v v v v v v v v v v v v v v v v What does it look like? v v v v v v v v © Print & Marketing Services (Vic) Pty. Ltd. v v v What does it sound like? v What does it feel like? “The only way to succeed is to risk failure” Bobby Jindal 147
