Student Activity Worksheet (data sheet)
advertisement
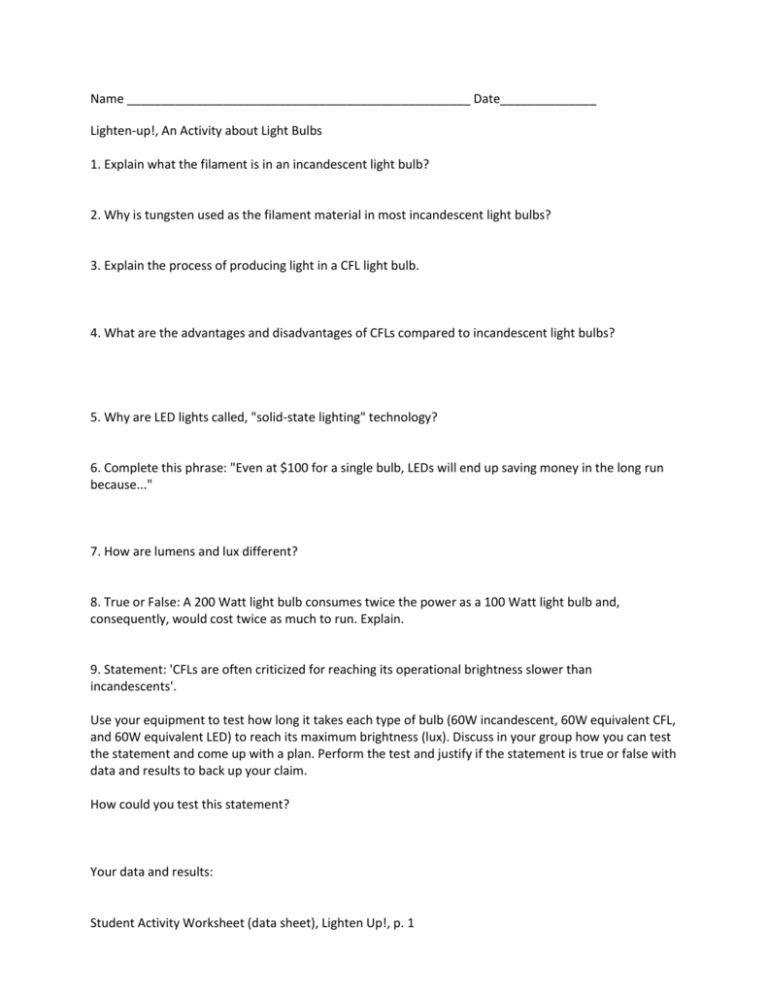
Name __________________________________________________ Date______________ Lighten-up!, An Activity about Light Bulbs 1. Explain what the filament is in an incandescent light bulb? 2. Why is tungsten used as the filament material in most incandescent light bulbs? 3. Explain the process of producing light in a CFL light bulb. 4. What are the advantages and disadvantages of CFLs compared to incandescent light bulbs? 5. Why are LED lights called, "solid-state lighting" technology? 6. Complete this phrase: "Even at $100 for a single bulb, LEDs will end up saving money in the long run because..." 7. How are lumens and lux different? 8. True or False: A 200 Watt light bulb consumes twice the power as a 100 Watt light bulb and, consequently, would cost twice as much to run. Explain. 9. Statement: 'CFLs are often criticized for reaching its operational brightness slower than incandescents'. Use your equipment to test how long it takes each type of bulb (60W incandescent, 60W equivalent CFL, and 60W equivalent LED) to reach its maximum brightness (lux). Discuss in your group how you can test the statement and come up with a plan. Perform the test and justify if the statement is true or false with data and results to back up your claim. How could you test this statement? Your data and results: Student Activity Worksheet (data sheet), Lighten Up!, p. 1 10. Can you find a mathematical relationship between the brightness of an incandescent bulb (lux readings) and its wattage? Use the following incandescent bulbs: 15W, 25W, 40W, 60W, 75W, 100W, 150W, and 200W. Use your equipment to come up with a plan. Control for distance. What should be your x data and what should be your y data? Discuss in your group, perform the experiment, and come up with the mathmatical relationship: Is the relationship linear? Should it be? What would the slope mean? 11. Would graphing incandescent wattage (watts, x data) and light output (lumens, y data) be a useful graph to construct? When I completed this graph, I got a fairly linear graph with a slope of around 18 Lumens / Watt. What does this slope mean? What would it mean for the light bulb if this slope was larger? 12. How does the brightness (lux readings) of a incandescent bulb change over distance? Can you find the mathematical relationship involved here? Discuss in your group how you can find this relationship. What variable is your x data and what variable would be your y data? Perform the experiment and come up with the mathematical relationship. Write down your data here: Draw what the graph here and write down your mathematical relationship. Student Activity Worksheet (data sheet), Lighten Up!, p. 2 13. Would a CFL and the LED light bulb behave in the same way, i.e. do you get similarly-shaped graphs? Perform the experiments to test the question. Write down your data here: Answer the question. 14. Did you find that bulbs got hot after being left on for a while? Which type of 60W bulb got hotter (incandescent, CFL, and LED)? Use the thermometer probe to find out how hot each type of bulb gets. Come up with a plan on how you could come up with temperature-time graph [time (x data) and temperature (y data)]. Perform the experiment for each type of bulb. Are these graphs linear? 15. Explain how the graphs in #14 can help explain the efficiency of the light bulbs. 16. Line up the incandescent bulbs in a row and also the CFLs in a row. What is your reaction to this? Student Activity Worksheet (data sheet), Lighten Up!, p. 3
