Modeling Throughput Performance in 802.11 WLAN
advertisement
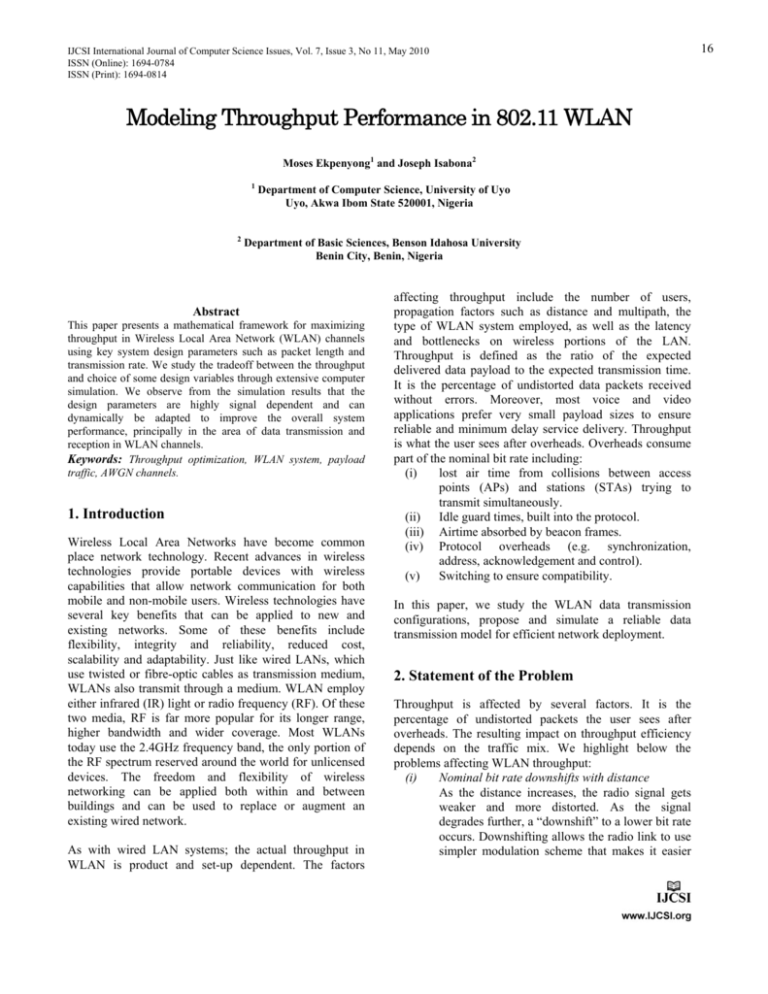
IJCSI International Journal of Computer Science Issues, Vol. 7, Issue 3, No 11, May 2010 ISSN (Online): 1694-0784 ISSN (Print): 1694-0814 Modeling Throughput Performance in 802.11 WLAN Moses Ekpenyong1 and Joseph Isabona2 1 2 Department of Computer Science, University of Uyo Uyo, Akwa Ibom State 520001, Nigeria Department of Basic Sciences, Benson Idahosa University Benin City, Benin, Nigeria Abstract This paper presents a mathematical framework for maximizing throughput in Wireless Local Area Network (WLAN) channels using key system design parameters such as packet length and transmission rate. We study the tradeoff between the throughput and choice of some design variables through extensive computer simulation. We observe from the simulation results that the design parameters are highly signal dependent and can dynamically be adapted to improve the overall system performance, principally in the area of data transmission and reception in WLAN channels. Keywords: Throughput optimization, WLAN system, payload traffic, AWGN channels. 1. Introduction Wireless Local Area Networks have become common place network technology. Recent advances in wireless technologies provide portable devices with wireless capabilities that allow network communication for both mobile and non-mobile users. Wireless technologies have several key benefits that can be applied to new and existing networks. Some of these benefits include flexibility, integrity and reliability, reduced cost, scalability and adaptability. Just like wired LANs, which use twisted or fibre-optic cables as transmission medium, WLANs also transmit through a medium. WLAN employ either infrared (IR) light or radio frequency (RF). Of these two media, RF is far more popular for its longer range, higher bandwidth and wider coverage. Most WLANs today use the 2.4GHz frequency band, the only portion of the RF spectrum reserved around the world for unlicensed devices. The freedom and flexibility of wireless networking can be applied both within and between buildings and can be used to replace or augment an existing wired network. As with wired LAN systems; the actual throughput in WLAN is product and set-up dependent. The factors affecting throughput include the number of users, propagation factors such as distance and multipath, the type of WLAN system employed, as well as the latency and bottlenecks on wireless portions of the LAN. Throughput is defined as the ratio of the expected delivered data payload to the expected transmission time. It is the percentage of undistorted data packets received without errors. Moreover, most voice and video applications prefer very small payload sizes to ensure reliable and minimum delay service delivery. Throughput is what the user sees after overheads. Overheads consume part of the nominal bit rate including: (i) lost air time from collisions between access points (APs) and stations (STAs) trying to transmit simultaneously. (ii) Idle guard times, built into the protocol. (iii) Airtime absorbed by beacon frames. (iv) Protocol overheads (e.g. synchronization, address, acknowledgement and control). (v) Switching to ensure compatibility. In this paper, we study the WLAN data transmission configurations, propose and simulate a reliable data transmission model for efficient network deployment. 2. Statement of the Problem Throughput is affected by several factors. It is the percentage of undistorted packets the user sees after overheads. The resulting impact on throughput efficiency depends on the traffic mix. We highlight below the problems affecting WLAN throughput: (i) Nominal bit rate downshifts with distance As the distance increases, the radio signal gets weaker and more distorted. As the signal degrades further, a “downshift” to a lower bit rate occurs. Downshifting allows the radio link to use simpler modulation scheme that makes it easier 16 IJCSI International Journal of Computer Science Issues, Vol. 7, Issue 3, No 11, May 2010 www.IJCSI.org for the equipment to distinguish between digital zeroes and ones. (ii) Contention between multiple-active users The throughput decreases if there are multiple simultaneously-active users transmitting data on the WLAN radio channel. The reason for this decrease is that these users experience collision and the colliding parties must wait for a defined “backoff” period before retransmitting. This results in lost airtime which affects the system’s throughput. (iii) Interference and coexistence The unlicensed nature of radio-based WLANs means that other products that transmit energy in the same frequency spectrum can potentially provide some measure of interference to a WLAN system. Microwave ovens are of potential concern, but most WLAN manufacturers design their products to account for this interference. Interference is a growing headache as WLAN popularity grows. It mostly arises from other APs and STAs on the same and/or adjacent radio channels, and can be mutual and harmful. To minimize interference, different radio channels can be used. Frequency optimization products are emerging to help manage interference. Another concern is the co-location of multiple WLAN. While WLANs from some manufacturers interfere, other coexists without interference. This issue is best addressed with the appropriate vendors. (iv) Interoperability of wireless devices Wireless LAN systems from different vendors may not be interoperable for the following reasons: First, different technologies will not interoperate. For instance, a system based on spread spectrum frequency hopping technology will not communicate with another system based on spread spectrum direct sequence technology. Secondly, systems using direct frequency bands will not interoperate even if they employ same technology. Thirdly, systems from different vendors may not interoperate even if they both employ same technology. Due to increasing users’ capacity and variety of wireless applications, telecommunication service providers need to provide better quality of service (QoS) to the end users. In this paper, we investigate how to provide improved system’s throughput and guarantee quality services in WLAN communication, taking into account the impact of the channel conditions. 17 3. Review of Related Works Several researches [3-4, 7] have studied the efficiency of the IEEE 802.11 protocol by investigating the maximum achievable throughput under various network configurations. They analyze the backoff mechanism and propose alternatives to improve the performance of existing standard mechanisms. In [3], a simple analytical model that computes saturation throughput performance assuming finite number of stations and ideal channel conditions is presented. This model extended in [4], with a consideration of the frame retry limits, which precisely predicts 802.11 DCF throughput. However, no known work yet exist that considers finite load throughput of 802.11 DCF and that which considers protocol parameters such as timeouts. A number of studies have emerged on the performance of WLANs using the 802.11 MAC protocol. Some preliminary investigations on the voice capacity of the IEEE 802.11b network have been conducted in [1], where they observed that in good channel conditions, a higher number of voice users can be supported by using larger payload sizes. The use of theoretical framework for rate adaptation to evaluate IEEE 802.11 is investigated in [2]. The authors propose a computationally expensive dynamic programming approach to find the optional data rates that can be used for fairly simple wireless channel variation models with known probability of transitions from good to bad states and vice versa. They accomplished this by using a discrete Markov Chain. A link adaptation strategy for IEEE 802.11b is provided in [5], where the frame lengths are classified into three broad categories: 0 - 100 bytes, 100 - 1000 bytes and 1000 - 2400 bytes. An early investigation on the effect of payload size on throughput is conducted in [6]. This paper considers the payload length as an optimization parameter and proposes a cross-layer scheme that jointly optimizes users’ throughput in IEEE 802.11a WLAN based on channel conditions. The theoretical formulation in this paper allows payload to be varied continuously over a wider range. A mathematical framework is then formulated to dynamically adapt the payload length to maximize the throughput for Additive White Gaussian Noise (AWGN) under different fading channels. 4. Throughput System Modeling We have defined throughput as the number of payload bits per second received correctly. For initial analysis, we consider the effect of payload variation in AWGN IJCSI International Journal of Computer Science Issues, Vol. 7, Issue 3, No 11, May 2010 www.IJCSI.org channels and assume that the acknowledgements from the receiver are free of errors. The throughput corresponding to the physical layer (PHY) mode j is given by: L (1) T ( j) bR P j , b, L LCj j s s where L is the payload length in bits C j is the header and DCF overhead corresponding to rate ‘j’ in bits. R j is the data rate corresponding to PHY mode j. b is the number of bits per MQAM symbol j Ps is the packet success rate (PSR) defined as the probability of receiving a packet correctly corresponding to PHY mode j. s is the SNR per symbol and is given by P s s N o N o Rs (2) where s , N o , and P represents the energy per symbol, the one-sided noise power spectral density and the received power respectively. C j takes into account the CSMA/CA channel access time and the header overhead as specified by the IEEE 802.11 protocol. The time delay is converted to bytes for the purpose of optimization by the expression C j Rs Tovh (3) where Rs is the transmission rate corresponding to PHY mode ‘s’ and Tovh is the total protocol overhead. Since any symbol error in the packet results in a loss of the packet, the packet success rate (PSR) is given in terms of the symbol error rate Pe by Ps s , b, L 1 Pe L, b, s (4) where the Pe of MQAM in AWGN channels for the j various PHY models in IEEE 802.11a is derived in [2]. In order to find the optimal payload length, L , we assume that the payload length L continuously varies. Differentiating equation (1) with respect to L and applying equation (4) produces the derivative in equation (5). T( j) L R 1 P j L ln 1 P j R Cj 1 P L (5) L j L Cj e s e j L2 e s Setting this derivative to zero, we obtain a quadratic equation in L with the root. Cj 1 4bC j (6) L C 2j 2 2 ln 1 Pe s , b 18 Thus, the optimal packet length L depends on the SNR per symbol s and the probability of the symbol error Pe . To find the data rate R j that maximizes the throughput, we differentiate equation (1) with respect to R j and obtain the following condition P , L T ( j ) L L Ps , L Rj s R j L Cj s R j L Cj (7) P , L Pj T ( j ) L Ps , L R j s R j s N o R j L Cj (8) Next, we set this derivative in equation (8) to zero Pj P , L 0 Ps , L N R s o j (9) Hence Ps , L s f , L s (10) We adopt the notation for signal-to-interference and noise ratio (SNR) that satisfies equation (10). Combining equation (10) and (4), we arrive at an equation for obtaining the preferred SNR per symbol Pe b, s 1 Pe b, L s s s b s s s thus, (11) where Pe of MQAM in AWGN channels [7] is approximately given by: 3 Pe b, s* 4 1 2 b / 2 Q b s 2 1 where Q is the error function and is given by Q( x) Once s 1 2 e (t 2 (12) x) / 2 is determined, the optimal symbol rate is obtained from equation (2) as Rs P No (13) * s Note that the solution s in equation (11) and (12) depends on only design parameters b and L, but is independent of the received power level. Using equations (2) – (12), equation (1) can be rewritten as 3 LC T j bRs 1 41 2 b / 2 Q b s (14) L 2 1 Equation (14) is computed under non-fading or slowly fading channels where the fade duration is longer than a packet period. Considering a flat Rayleigh fading IJCSI International Journal of Computer Science Issues, Vol. 7, Issue 3, No 11, May 2010 www.IJCSI.org channel, the average probability of the symbol error Pe approximates to [8]: 3 s Pe b, s 2 1 2 b / 2 1 2 2b 1 3 s 19 The input parameters were used to simulate the derived model in section 4. The following section analyses and interprets the results obtained from the simulation. (15) Also, rewriting equation (1) from equation (15) gives T j LC bRs 2 1 2 b / 2 L 3 1 s 2 2 b 1 3 s (16) 5. Simulation Input and Form Design Table 1 shows the parameter list and values for the simulation input. The table represents empirical parameters obtained from ideal conditions. Our reason for simulating with ideal environmental conditions is to make the simulation real and suitable for precise prediction. Figure 2. Input form for Symbol error rate simulation Table 1. Model input parameters Parameter Value Packet Length (L) 64, 128, 256 Data rate (Rs) 500, 250, 150 Date transmission overhead 20 Tovh Number of bits (b) Bit error rate Pe s 1, 2, 4, 6, 8 0.01 – 0.1 SNR (1 – 10)dB s Input forms were designed to accept the various parameters for the simulation. Figures 1- 3 show the sample input forms for the simulation: Figure 3. Input form for simulation interface 6. Discussion and Interpretation of Simulation Results In this section, we represent the simulation results graphically to enable us interpret them with precision. Figure 1. Input form for Optimum packet length simulation In Figure 4, the optimum packet length (L*) is a decreasing function of the bit error rate (BER). As the bit error rate decreases, the packet error rate approaches zero, and the optimum packet length increases without bounds. In Figure 5, since BER decreases with increased SNR, the optimum packet length increases monolithically with the SNR. This shows that better channels support longer packets. Of course, in practice, the packet length (L) is an IJCSI International Journal of Computer Science Issues, Vol. 7, Issue 3, No 11, May 2010 www.IJCSI.org integer or the smallest integer greater than the optimum packet length (L*). Bit error rate 1.20 Figures 6 and 7, shows the throughput as a function of the BER, with varied number of bits. We observe from these graphs that as the BER increases, the rate necessary to maximize the throughput increases. This performance indicates a strong relationship between the throughput and BER and calls for a good choice of appropriate parameters for effective WLAN data transmission and reception. 1.00 0.80 0.60 In figures 8 and 9, graphs of throughput vs. SNR are presented, with varied transmission rate. As observed from these graphs, the throughput increases with SNR, such that the higher the transmission rate, the higher the throughput. This shows that throughput can be jointly optimized with the SNR and transmission rate. 0.40 0.20 450.00 Optimumpacket length (L) 20 0.00 0 2 4 6 8 10 12 SNR 400.00 Figure 5. A graph of bit error rate vs. SNR per symbol in Rayleigh fading Data rate = 500 Data rate = 250 Data rate = 150 350.00 300.00 Throughput 800.00 250.00 700.00 200.00 600.00 150.00 500.00 b=2 b=4 100.00 400.00 50.00 0.00 300.00 0 0.02 0.04 0.06 0.08 0.1 0.12 Bit error rate Figure 4. A graph of optimum packet length vs. bit error rate 200.00 100.00 0.00 0 2 4 6 8 10 12 SNR Figure 6. A graph of Throughput vs. SNR per symbol in Rayleigh fading, with varied number of bits IJCSI International Journal of Computer Science Issues, Vol. 7, Issue 3, No 11, May 2010 www.IJCSI.org 400.00 Throughput 1.20E+04 Throughput 21 350.00 1.00E+04 300.00 8.00E+03 250.00 b=2 b=4 6.00E+03 Data rate = 500 Data rate = 250 Data rate = 150 200.00 150.00 4.00E+03 100.00 2.00E+03 50.00 0.00 0.00E+00 0 0 2 4 6 8 10 2 4 6 8 10 12 12 SNR SNR Figure 8. A graph of bit error rate vs. SNR per symbol in Rayleigh fading with varied data rate 6.00E+03 Throughput Figure 7. A graph of Throughput vs. SNR per symbol in non-Rayleigh fading, with varied number of bits 5.00E+03 4.00E+03 Data rate = 500 Data rate = 250 Data rate = 150 3.00E+03 2.00E+03 1.00E+03 0.00E+00 0 2 4 6 8 10 12 SNR Figure 9. A graph of bit error rate vs. SNR per symbol in non-Rayleigh fading with varied data rate IJCSI International Journal of Computer Science Issues, Vol. 7, Issue 3, No 11, May 2010 www.IJCSI.org 5. Conclusions This paper has presented a framework for achieving higher throughput by careful adaptation of packet (payload) length and data rate with varying channel conditions. We studied the WLAN data configurations, and have proposed a reliable data transmission model for efficient network deployment. A mathematical model under fading and non fading channels that improves the system’s throughput for optimal performance in generic WLAN systems is also presented. The proposed model has been evaluated through extensive computer simulation subject to both Rayleigh and Non-Rayleigh fading channels. The simulation results were analyzed and relationships between the model parameters established. References [1] [2] [3] [4] [5] [6] [7] [8] D. P. Hole and F. A. Tobagi. “Capacity of an IEEE 802.11b Wireless LANS Supporting VOIP”, in Proceedings of IEEE ICC, 2004, pp. 196 – 201. D. Qiao, S. Choi and K. G. Shin. “Goodput Analysis and Link Adaptation for IEEE 802.11a Wireless LANs”. IEEE Transactions on Mobile Computing. Vol. 1. No. 4, pp. 278-292. G. Bianchi. “Performance Analysis of the IEEE 802.11 Distributed Coordination Function”. IEEE Journal on Selected Areas in Communications. Vol. No. 3, 2000, pp. 535-547. H. Wu, Y. Peng, K. Long, J. Cheng and J. Ma. “Performance of Reliable Transport Protocol over IEEE 802.11 Wireless LAN: Analysis and Enhancement”, in Proceedings of IEEE INFOCOMM, Vol. 2, pp. 599-607. J. P. Pavon and S. Choi. “Link Adaptation Strategy for IEEE 802.11 WLAN via Received Signal Strength Measurement”, in Proceedings of IEEE ICC, 2003, pp. 1108-1113. P. Lettieri and M. B. Srivastava. “Adaptive Frame Length Control for Improving Wireless Link Throughput, Range and Engery Efficiency”, in INFOCOM, Vol. 2, 1998, pp. 564-571. J. G. Proakis. Digital Communications. New York, NY, McGraw-Hill Inc., third ed., 1995. A. Goldsmith and S. G. Chua, “Variable-rate variable-power M-QAM for fading channels,” IEEE Transaction on Communication., vol. 45, pp. 1218–1230. Ekpenyong, Moses. Moses Ekpenyong is a lecturer the Department of Mathematics, Statistics and Computer Science, University of Uyo, Nigeria. He obtained his B.Sc. and M.Sc. degrees in Computer Science, but his PhD (in view) is in the area of Speech Technology. He is a member of the following professional bodies: Nigerian Association of Mathematical Physics 22 (NAMP), Nigeria Computer Society (NCS), International Speech and Communications Association (ISCA), Nigeria Mathematical Society (NMS), Nigerian Statistical Association (NSA) and WestAfrican Linguistics Society (WALS). He is an International researcher and enjoys fruitful collaboration with academicians both within Nigeria and abroad (from other fields) and has published widely in the area of wireless communications. His area of specialization is speech modeling and communications technology. Isabona, Joseph is a Lecturer at the Benson Idahosa University, Benin City, Nigeria. He has B.Sc. and M.Sc. degrees in Theoretical Physics and Physics Electronics/ Communications respectively. His PhD (in view) is in the area of Physics Electronics. He is a member of the Nigerian Association of Mathematical Physics (NAMP). He has published both nationally and internationally in the area of wireless communications. His area of specialization is signal processing and radio resource management in wireless networks.

