TIE-35: Transmittance of optical glass
advertisement
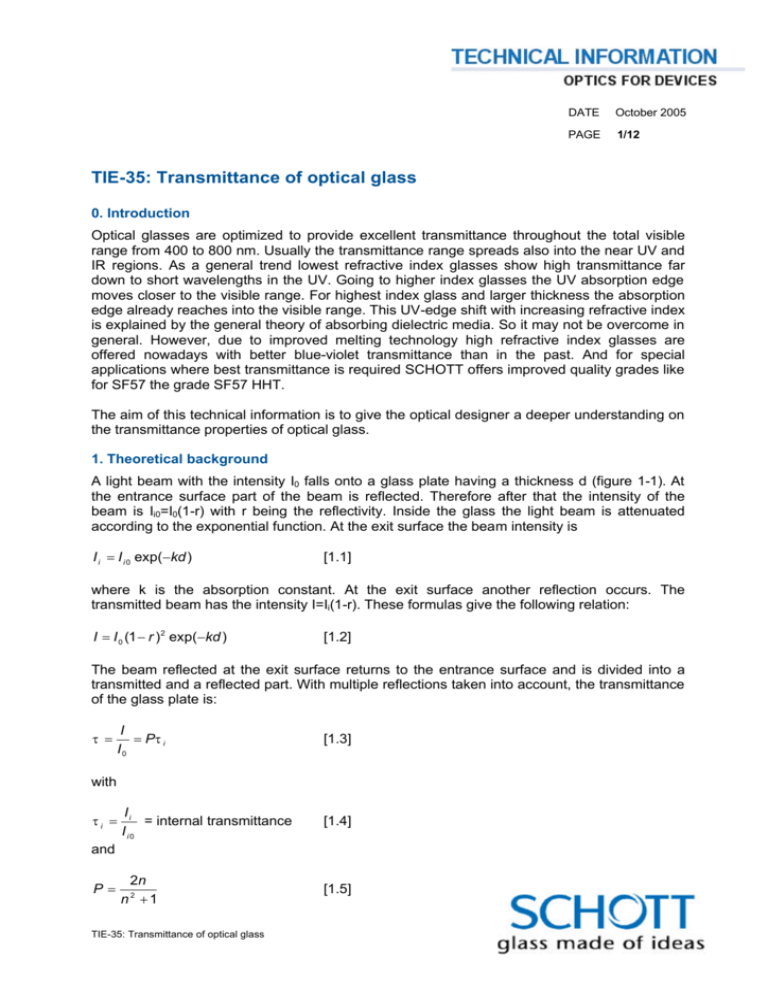
. . . . . . DATE October 2005 PAGE 1/12 TIE-35: Transmittance of optical glass 0. Introduction Optical glasses are optimized to provide excellent transmittance throughout the total visible range from 400 to 800 nm. Usually the transmittance range spreads also into the near UV and IR regions. As a general trend lowest refractive index glasses show high transmittance far down to short wavelengths in the UV. Going to higher index glasses the UV absorption edge moves closer to the visible range. For highest index glass and larger thickness the absorption edge already reaches into the visible range. This UV-edge shift with increasing refractive index is explained by the general theory of absorbing dielectric media. So it may not be overcome in general. However, due to improved melting technology high refractive index glasses are offered nowadays with better blue-violet transmittance than in the past. And for special applications where best transmittance is required SCHOTT offers improved quality grades like for SF57 the grade SF57 HHT. The aim of this technical information is to give the optical designer a deeper understanding on the transmittance properties of optical glass. 1. Theoretical background A light beam with the intensity I0 falls onto a glass plate having a thickness d (figure 1-1). At the entrance surface part of the beam is reflected. Therefore after that the intensity of the beam is Ii0=I0(1-r) with r being the reflectivity. Inside the glass the light beam is attenuated according to the exponential function. At the exit surface the beam intensity is I i = I i 0 exp(−kd ) [1.1] where k is the absorption constant. At the exit surface another reflection occurs. The transmitted beam has the intensity I=Ii(1-r). These formulas give the following relation: I = I 0 (1 − r ) 2 exp(−kd ) [1.2] The beam reflected at the exit surface returns to the entrance surface and is divided into a transmitted and a reflected part. With multiple reflections taken into account, the transmittance of the glass plate is: τ = I = Pτ i I0 [1.3] with τi = Ii = internal transmittance Ii0 [1.4] 2n n2 +1 [1.5] and P= TIE-35: Transmittance of optical glass . . . . . . DATE October 2005 PAGE 2/12 P is called the “reflection factor” and has been derived from Fresnel’s formula which describes the relation between the reflectivity r and the refractive index n. Taking the refractive index range of optical glass from 1.4 to 2.1 the reflection factor P ranges from 0.92 to 0.75. Figure 1-1: Change in the intensity of a light beam passing through a glass plate [1] The transmittance is thickness dependent. If the internal transmittance τi1 of a plate with thickness d1 is known, it is possible to calculate the internal transmittance τi2 of a plate with a thickness d2: τ i 2 = τ i1 ( d 2 / d 1) [1.6] 2. Wavelength dependence of transmittance The transmittance of an optical glass is inversely proportional to its spectral absorption. The absorption bands of a glass are closely related to its dispersion behavior. The dispersion is a measure of the change of the refractive index with wavelength. Dispersion can be explained by applying the electromagnetic theory to the molecular structure of matter. If an electromagnetic wave impinges on an atom or a molecule the bound charges vibrate at the frequency of the incident wave. The bound charges have resonance frequencies at certain wavelengths. A plot of the refractive index n as a function of the wavelength for fused silica can be seen in Figure 2-1. In the main spectral transmittance region the refractive index increases towards shorter wavelength. The dotted line shows the absorption coefficient k as a function of the wavelength. TIE-35: Transmittance of optical glass . . . . . . DATE October 2005 PAGE 3/12 UV-Edge Figure 2-1: Measured optical constants of fused silica (SiO2 glass). The influence of the UV-edge on the refractive index is clearly visible. [1] Regions of strong dispersion, with steep slopes in the refractive index curve, correspond to absorption bands, this can be clearly seen in figure 2-1. If for example the UV transmittance edge (short wavelength edge) of the glass is shifted to shorter wavelengths, meaning that the glass has a good transmittance in the blue and near UV region, the dispersion of the glass in the visible (the slope of the n(λ) curve) is very low. This is valid for low refractive index glasses. In high refractive index glasses the UV edge of the transmittance curve is shifted to longer wavelengths, therefore the refractive index in the visible is much higher and the slope (dispersion) much steeper. It is useful to note that the refractive index, dispersion and transmittance are tightly connected. Figure 2-2 shows the internal transmittance of a typical N-BK7 sample. Between 400 nm and 1060 nm the internal transmittance is higher than 99% for a 25 mm thick sample. In the ultraviolet (UV) and infrared (IR) wavelength range (below 400 nm and over 1060 nm wavelength for N-BK7) the transmittance decreases rapidly due to absorption effects. TIE-35: Transmittance of optical glass . . . . . . DATE October 2005 PAGE 4/12 Figure 2-2: Internal transmittance of N-BK7 2.1 UV transmittance The UV Transmittance characteristic is mostly influenced by heavier elements in the glass composition (like e.g. lead, barium, niobium, titanium, lanthanum), melting technology and/or residual impurities. These heavier elements are necessary to achieve a high refractive index but decrease the transmittance in the blue region. Therefore high refractive index glasses in bigger thickness often show a yellowish color. Nevertheless there are differences in the characteristic of the UV transmittance edge depending on which heavy elements are used in the glass composition. For example lead containing SF glasses exhibit a better transmittance in the blue spectral region compared to NSF glass types were lead was substituted by titanium or niobium. The melting process also influences the transmittance characteristics of a glass, for example platinum parts in the melting tank could be the source for platinum impurities in the glass leading to a weaker UV transmittance. Modern melting techniques aiming for the reduction of platinum contact with the melt therefore lead to better transmittance characteristics. Therefore it is also possible that the transmission of the eco versions of a heavy flint (N-SF) exhibits a higher transmission than the lead-containing version in the blue area if the N-SF version is continuously produced in a tank, due to it’s high demand in mass markets and its lead containing equivalence glass type has to be discontinuously produced in the pot, as it has been observed with N-SF14/SF14 and N-SF11/SF11. The simple rule that the eco version of a heavy flint always exhibits a lower transmission in the blue area is therefore only valid if both versions are continuously produced under similar conditions. TIE-35: Transmittance of optical glass . . . . . . DATE October 2005 PAGE 5/12 The UV transmittance edge does not only depend on the composition of the glass but also on the thickness. With an increasing thickness the transmittance edge is shifted to longer wavelengths. Figure 2-3 shows a comparison of the transmittance near the UV edge between different refractive indices, different composition and material thickness. Figure 2-3: Catalog transmittance data of N-PK52A, N-SF57 and SF57 It should also be noted that increasing temperatures slightly shift the UV edge to longer wavelengths due to broadening of the UV absorption bands. The UV transmission is important for microlithography applications. Optical glasses with excellent homogeneity and transmittance at 365 nm are for example FK5 HT, LLF1 HT and LF5 HHT with transmittance >99% at 10 mm thickness [2]. Fused silica exhibits an excellent transmittance (98%) down to 193 nm [3]. The transmittance of CaF2 crystals is >99% at 157 nm wavelength [4]. 2.2 Infrared transmittance The infrared transmittance is mainly influenced by the OH content in the melt. The OH absorption bands are sensitive to the atomic surrounding, therefore the absorption band typically occurs between 2.9 µm and 4.2 µm. Figure 2-3 shows the infrared transmittance of KZFSN5 as an example. The sudden decreases in the transmission indicate absorption bands. TIE-35: Transmittance of optical glass . . . . . . DATE October 2005 PAGE 6/12 Figure 2-3: Infrared Transmittance curve of KZFSN5 The infrared transmittance is very sensitive to different melting techniques. Figure 2-4 shows the comparison of the transmittance of N-SF6 from a pot melt and from a typical tank melting process. The transmittance within the UV and visible range up to 1060 nm of N-SF6 is nearly unaffected by the different production methods. The transmittance in the infrared region decreases stronger for the tank melted N-SF6. The tank melting process is a continuous melting process to produce large amounts of glass with constant properties in an economic way. Therefore more and more glasses are switched from the pot melting to the tank melting process. Please tell your SCHOTT sales contact person in advance if special transmittance characteristics in the infrared region are relevant for your product. The infrared absorption edge is shifted to shorter wavelengths if the temperature of the glass increases significantly. SCHOTT offers some materials with an enhanced transmission at infrared wavelengths. A typical glass for example is IRG11A with an improved transmission from 3.8 µm to 4.7 µm. To get more detailed information please contact your sales representative. TIE-35: Transmittance of optical glass . . . . . . DATE October 2005 PAGE 7/12 Figure 2-4: Comparison of typical transmittance curves of N-SF6 coming from two different melting techniques. 2.3 Solarization Electromagnetic radiation influences the transmittance of a glass depending on glass type and the wavelength of radiation. The influence of visible and UV radiation (less than 380 nm wavelength) on glass is called solarization. The UV radiation generates color-centers in the glass leading to a reduced transmittance. The solarization behaviour of optical glass can be investigated by irradiation with a xenon or mercury lamp, or with UV lasers. Glasses with low UV transmittance – e.g. with a high lead content (F and SF types) – normally have small solarization effects. Several crown glasses with a higher ultraviolet transmittance change their UV-transmittance edge: PSK, BaLK, K, ZK, BaK, SK and LaK. The steepness of the transmittance edge becomes smaller. This effect can be reversed at higher temperatures (the higher the temperature the faster the effect will be reversed). Figure 2-5 shows the solarization behavior of N-BK7. The sample was irradiated with an UV lamp (HOK Hg lamp, maximum at 365 nm) for about 15 hours at a distance of 7 cm at a temperature of 90°C. The UV edge is only slightly shifted to longer wavelengths. TIE-35: Transmittance of optical glass . . . . . . DATE October 2005 PAGE 8/12 Figure 2-5: Solarization behaviour of N-BK7 irradiated with a HOK lamp for 15 hours. The influence of UV radiation can be partly suppressed by doping the glass with CeO2. The doping shifts the UV-transmittance edge to longer wavelengths. This edge is stable then. Also in the case of irradiation with sources of higher quantum energies (X-rays, γ-rays) CeO2 doping proves protective. In the case of neutron and electron radiation the protective effect of CeO2 doping depends on the glass type. Therefore the radiation load to which the glass will be exposed must be considered when choosing a certain optical glass CeO2 doped glasses are indicated with a G plus number behind the glass name. Typical examples are: BK7G18, K5G20, LAK9G15, LF5G19 and SF6G05. TIE-35: Transmittance of optical glass . . . . . . DATE October 2005 PAGE 9/12 3. Measurement and specification 3.1 Transmittance measurement setup The transmittance of optical glass is measured using double beam spectral photometers from the company Perkin Elmer with special modifications. The standard setup enables to measure within a wavelength region from 250 nm up to 2500 nm. The measurement accuracy over the complete spectrum is about ±0.5%. Within 400 nm to 700 nm the accuracy is ±0.3%. The wavelength can be measured with an accuracy of ±0.2 nm and ±0.8 nm. Standard measurement sample thickness is 25 mm (20 mm x 15 mm x 25 mm). Figure 3-1: Spectral photometer from Perkin-Elmer With an improved setup it is possible to increase the transmittance measurement accuracy in the UV and visible range (200 – 850 nm) to ±0.08% and in the near infrared range (850 – 2500 nm) to ±0.3% (with ±0.02 nm in the UV/VIS and ±0.08 nm in the NIR). Additionally it is possible to expand the wavelength range from 2500 nm to 16600 nm. Within these range the measurement accuracy is ±1%. 3.2 Transmittance specification SCHOTT attempts to achieve the best possible internal transmittance. However, due to cost and availability constraints, some deviations in the purity of the raw materials must be accepted. SCHOTT maintains minimum standards for the resulting deviations in internal transmission of melted glasses. The spectral transmittance of the optical glasses for 10 mm and 25 mm thickness are listed in the data sheets. The transmittance data given in the data sheets comprises median values from several melts of a glass type in general expect for HT or HHT (refer to chapter 3.3). Upon request minimum values for internal transmittance can be maintained. It should also be addressed in advance if special transmission characteristics in the infrared region are crucial for the application. Prior clarification of the delivery situation is required. TIE-35: Transmittance of optical glass . . . . . . DATE October 2005 PAGE 10/12 3.3 Color code specification The color code is a description of the position and slope of the UV transmittance edge. The color code lists the wavelength λ80 and λ5, at which the transmittance (including reflection losses) is 0.8 and 0.05 at 10 mm thickness. The values are rounded to 10 nm and are noted by eliminating the first digit. Color code 33/30 means for example λ80= 330 nm and λ5 = 300 nm. For high index glass types with nd > 1.83 the data of the color codes refer to the transmittance values 0.70 and 0.05 (λ70 and λ5) because of the high reflection loss of this glass (refer to figure 3-2). The color code given in the data sheets should be regarded as a median value. Upon request minimum values for internal transmittance can be maintained. Prior clarification of the delivery situation is required. Figure 3-2: Color code definition for high index glass types 3.4 HT and HHT quality Some glasses are offered in HT or HHT quality (e.g. SF6, SF57 but also F2 and the I-Line glasses FK5, LLF1 and LF5). The internal transmittance of these glasses (absolute and color codes) exceeds the quality of the normal type. The HT and HHT transmittance values given in the catalog can be regarded as minimum values. Figure 3-3 shows a comparison of SF57, SF57 HT and SF57 HHT. Figure 3-4 shows a comparison of the SF57 HHT catalog transmittance curve with an actual optimized SF57 HHT melt. The datasheets can be downloaded from our internet page [5] TIE-35: Transmittance of optical glass . . . . . . DATE October 2005 PAGE 11/12 Figure 3-3: Comparison of SF57 and its HT and HHT variations. Figure 3-4: Comparison of SF57 HHT catalog specification and actual sample melt transmittance. TIE-35: Transmittance of optical glass . . . . . . DATE October 2005 PAGE 12/12 4. Literature [1] The properties of optical glass; H. Bach & N. Neuroth (Editors), Springer Verlag 1998 [2] http://www.schott.com/lithotec/english/products/I-Line/i-line.html [3] http://www.schott.com/lithotec/english/products/Fused_Silica/fused_Silica.html [4] http://www.schott.com/lithotec/english/products/calcium_Fluoride/calcium_fluoride.html [5] http://www.schott.com/optics_devices/english/products/flash/abbediagramm_flash.html For more information please contact: Optics for Devices SCHOTT North America, Inc. 400 York Avenue Duryea, PA 18642 USA Phone: +1 (570) 457-7485 Fax: +1 (570) 457-7330 E-mail: sgt@us.schott.com www.us.schott.com/optics_devices TIE-35: Transmittance of optical glass
