D E C E M B E R 2 0 0 8 • A M O N T H LY C A N A D I A N P U B L I C AT I O N F R O M T H E P O W E R I N F O R M AT I O N N E T W O R K ( P I N )
Benefits of Retail Finance and Lease Transactions
Retail finance and lease transactions benefit both
dealers and manufacturers more than straight cash
transactions, as a substantial proportion of both types
of deals include the sale of service contracts and/or
insurance. These additional products and their gross
profits are in addition to the finance reserve income
dealers earn on loans.
or lease transactions. The contract penetration level is
much lower because cash customers do not always go
through the Finance and Insurance Department.
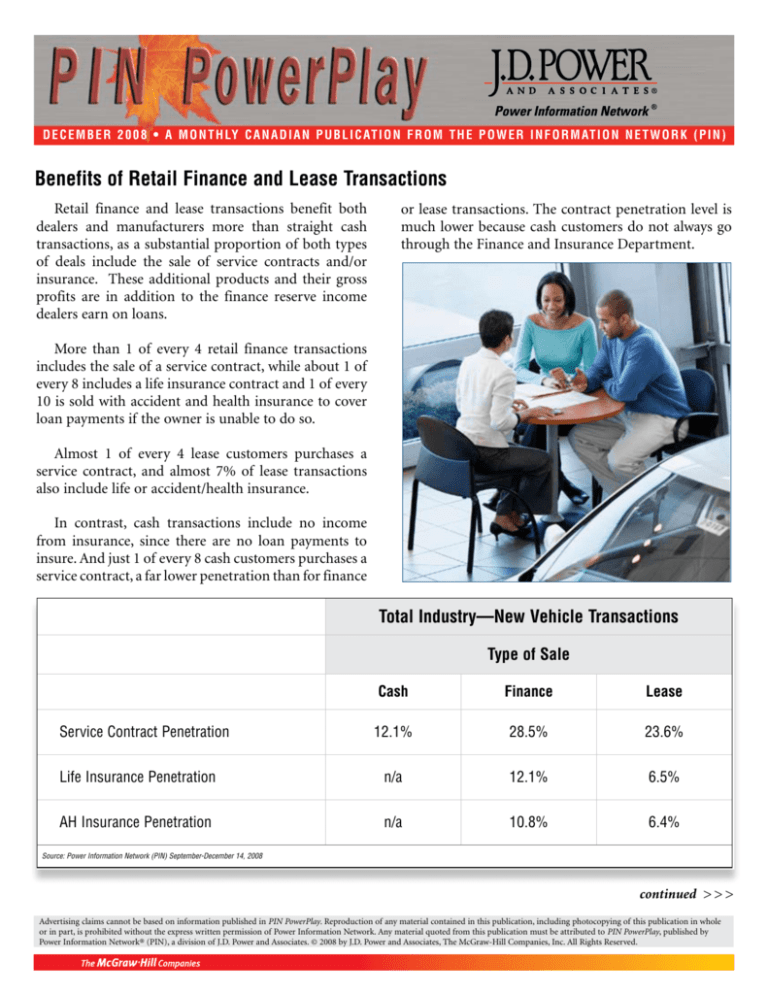
More than 1 of every 4 retail finance transactions
includes the sale of a service contract, while about 1 of
every 8 includes a life insurance contract and 1 of every
10 is sold with accident and health insurance to cover
loan payments if the owner is unable to do so.
Almost 1 of every 4 lease customers purchases a
service contract, and almost 7% of lease transactions
also include life or accident/health insurance.
In contrast, cash transactions include no income
from insurance, since there are no loan payments to
insure. And just 1 of every 8 cash customers purchases a
service contract, a far lower penetration than for finance
Total Industry—New Vehicle Transactions
Type of Sale
Cash
Finance
Lease
12.1%
28.5%
23.6%
Life Insurance Penetration
n/a
12.1%
6.5%
AH Insurance Penetration
n/a
10.8%
6.4%
Service Contract Penetration
Source: Power Information Network (PIN) September-December 14, 2008
continued > > >
Advertising claims cannot be based on information published in PIN PowerPlay. Reproduction of any material contained in this publication, including photocopying of this publication in whole
or in part, is prohibited without the express written permission of Power Information Network. Any material quoted from this publication must be attributed to PIN PowerPlay, published by
Power Information Network® (PIN), a division of J.D. Power and Associates. © 2008 by J.D. Power and Associates, The McGraw-Hill Companies, Inc. All Rights Reserved.
D E C E M B E R 2 0 0 8 • A M O N T H LY C A N A D I A N P U B L I C AT I O N F R O M T H E P O W E R I N F O R M AT I O N N E T W O R K ( P I N )
> > > continued
Redesigned 2009 Mazda6 Appeals to Young Buyers
The 2009 Mazda6, completely restyled with a more aggressive appearance, went on sale in Canada in September. Since then,
it has been attracting younger buyers than the buyers of all competitor models except the Accord. Mazda6 buyers are, on average,
7 years younger than the typical buyers of midsize non-premium conventional sedans.
About 3 of every 10 transactions for the 2009 Mazda6 have included a trade, and about 16% of these trades have been
“upside down,” which is almost twice the segment average. This mix of upside down trades is higher than that for any competitor except the Fusion.
The percentage of Mazda6 trades coming from competitive brands (58%) is higher than that for any competitor except the
Altima, and more than twice as high as for the Sebring and Accord.
Only about 1 of every 6 Mazda6 buyers has paid
with cash, less than half the subsegment average and
the third-lowest cash mix after the Malibu and Fusion.
Mazda6 buyers have been much more likely than
typical midsize sedan buyers to either take out a loan
or lease their vehicles, due in part to Mazda’s current
0% APR program (on 36-month loans). This incentive
program will soften the impact of the Mazda6 transaction price, which is currently higher than that of all
competitors except the Accord, and more than $3,000
above segment average.
2009 Mazda6
Lastly, the new Mazda6 has been sitting on dealer
lots an average of just 16 days before being sold, which
is the lowest turn rate in its competitive set and 10 days
lower than the segment average. Since the initial retail
turn rate for most new or redesigned models is low,
it will take a few more months before the Mazda6’s
natural, ongoing turn rate will be evident. ■
Type of Sale
Models
Model Customer Female Trade In Percent Trade-In
Year (Buyer) (Buyer) (%)
Negative
Same
Cash Finance
Lease
Age
(%)
Equity Nameplate
(%)
(%)
(%)
(%)
Vehicle Retail
Price Less Turn
Customer Rate
Cash Rebate
Midsize Conventional Seg. . . 2009 . . . . 54 . . . . . 36.6% . . . . 32.7% . . . . 8.4% . . . . 47.3% . . . . . 34.0% . . . . 46.6% . . . . 19.4% . . . . $26,144 . . . 26
Mazda6 . . . . . . . . . . . . . . . . 2009 . . . . 47 . . . . . 39.7% . . . . 30.8% . . . 16.0% . . . . 42.0% . . . . . 15.7% . . . . 57.5% . . . . 26.9% . . . . $29,442 . . . 16
Chrysler Sebring . . . . . . . . . 2009 . . . . 59 . . . . . 53.7% . . . . 16.6% . . . . 0.0% . . . . 77.6% . . . . . 47.4% . . . . 48.8% . . . . . 3.8% . . . . $23,895 . . . 22
Chevrolet Malibu . . . . . . . . . 2009 . . . . 53 . . . . . 37.8% . . . . 34.7% . . . 11.8% . . . . 42.6% . . . . . . 8.3% . . . . 90.4% . . . . . 1.3% . . . . $24,841 . . . 21
Ford Fusion . . . . . . . . . . . . . 2009 . . . . 54 . . . . . 28.4% . . . . 22.9% . . . 18.6% . . . . 55.9% . . . . . 14.5% . . . . 69.6% . . . . 15.8% . . . . $24,040 . . . 27
Honda Accord . . . . . . . . . . . 2009 . . . . 47 . . . . . 45.5% . . . . 30.9% . . . . 1.4% . . . . 74.7% . . . . . 52.1% . . . . 20.9% . . . . 27.0% . . . . $30,756 . . . 24
Hyundai Sonata . . . . . . . . . . 2009 . . . . 59 . . . . . 36.3% . . . . 36.7% . . . 13.0% . . . . 47.0% . . . . . 39.2% . . . . 33.4% . . . . 27.4% . . . . $23,973 . . . 35
Nissan Altima . . . . . . . . . . . . 2009 . . . . 50 . . . . . 40.3% . . . . 25.6% . . . . 9.3% . . . . 32.0% . . . . . 19.9% . . . . 62.1% . . . . 18.0% . . . . $28,690 . . . 19
Toyota Camry . . . . . . . . . . . . 2009 . . . . 55 . . . . . 38.9% . . . . 35.4% . . . . 4.8% . . . . 45.7% . . . . . 42.1% . . . . 33.2% . . . . 24.6% . . . . $24,733 . . . 30
Source: Power Information Network (PIN), January–December 7, 2008
Note: If a unit is dealer-traded, the retail turn rate returns to zero at the time of the trade
Advertising claims cannot be based on information published in PIN PowerPlay. Reproduction of any material contained in this publication, including photocopying of this publication in whole
or in part, is prohibited without the express written permission of Power Information Network. Any material quoted from this publication must be attributed to PIN PowerPlay, published by
Power Information Network® (PIN), a division of J.D. Power and Associates. ©2008 by J.D. Power and Associates, The McGraw-Hill Companies, Inc. All Rights Reserved.

