Chapter 9 Confidence Intervals
advertisement
Tutorial for the integration of the software R with introductory statistics
c Grethe Hystad
Copyright Chapter 9
Confidence Intervals
In this chapter, we will discuss the following topics:
• How to find critical values from the Normal distribution using the R-function qnorm.
• How to compute confidence intervals for the mean when the standard deviation is
known.
Confidence Interval for a Population Mean with known Standard Deviation
Assume a simple random sample, X1 , X2 ..., Xn , of size n is drawn from a Normal population
with unknown mean µ and known standard P
deviation σ. Assume x1 , x2 ,..., xn are the
observed values of the sample with mean x̄ = ni=1 xi . A 100(1 − α)% Confidence interval
for µ is
σ
x̄ ± z ∗ √ ,
n
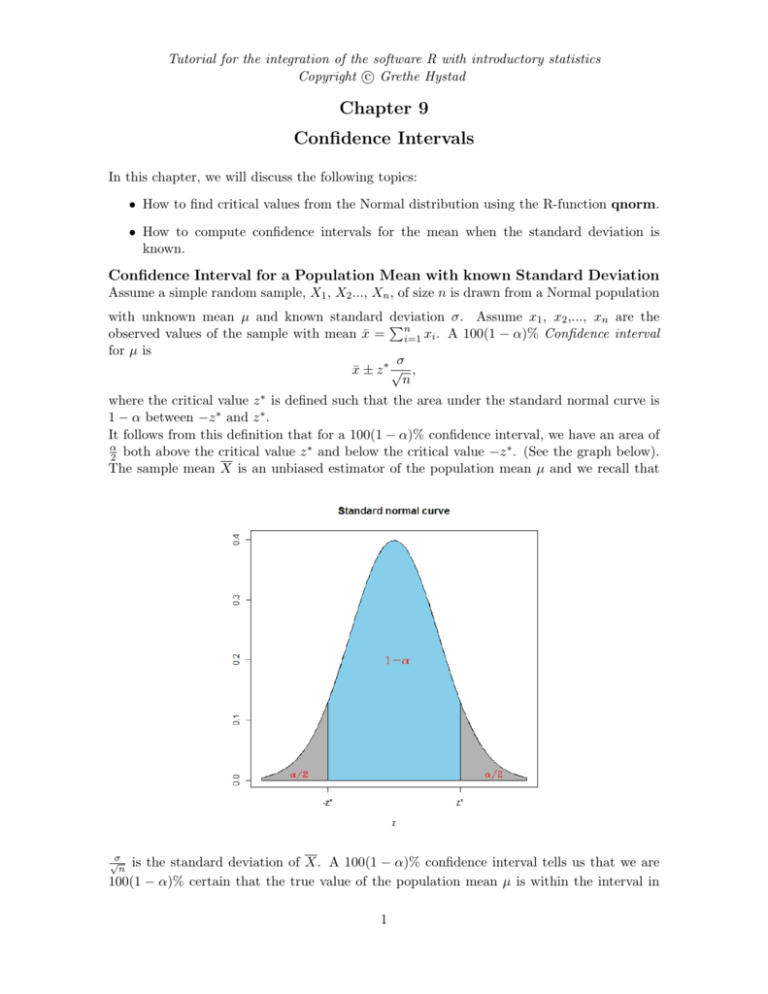
where the critical value z ∗ is defined such that the area under the standard normal curve is
1 − α between −z ∗ and z ∗ .
It follows from this definition that for a 100(1 − α)% confidence interval, we have an area of
α
∗
∗
2 both above the critical value z and below the critical value −z . (See the graph below).
The sample mean X is an unbiased estimator of the population mean µ and we recall that
√σ
n
is the standard deviation of X. A 100(1 − α)% confidence interval tells us that we are
100(1 − α)% certain that the true value of the population mean µ is within the interval in
1
repeated samples. Why does the 100(1 − α)% confidence interval look this way? To answer
this question, we first standardize the sample mean X such that
Z=
X −µ
√σ
n
is standard normal. Then we find the critical value z ∗ such that the area under the standard
normal curve between −z ∗ and z ∗ is (1 − α), that is,
X −µ
∗
1 − α = P (−z ∗ ≤ Z ≤ z ∗ ) = P − z ∗ ≤
.
≤
z
σ
√
n
Now, this expression is equivalent to
∗ σ
∗ σ
1−α=P X −z √ ≤µ≤X +z √ .
n
n
Then if x1 , x2 ,..., xn are the observed values,
∗ σ
∗ σ
x̄ − z √ , x̄ + z √
n
n
is a 100(1 − α)% confidence interval for the population mean µ.
Problem. Use R to find the critical value z ∗ for confidence level:
(a) 95%
(b) 80%
Solution to part (a). Here α = 0.05 and the total area below the critical value z ∗ is
1 − α2 = 1 − 0.05
2 = 0.975. Also consider the first graph below. If we add together the
probabilities in the yellow and blue shade of the graph, we obtain 0.25 + 0.95 = 0.975. We
want to find z ∗ such that there is a probability of 0.975 that the standard normal random
variable, Z, is less than or equal to z ∗ ; that is, P (Z ≤ z ∗ ) = 0.975. In R this can be done as:
> qnorm(0.975)
[1] 1.959964
Hence, z ∗ = 1.960.
Solution to part (b). Consider the second graph below. If we add together the probabilities
in the yellow and blue shade of the graph, we obtain 0.10 + 0.80 = 0.90. We want to find z ∗
such that P (Z ≤ z ∗ ) = 0.90. In R this can be done as:
> qnorm(0.90)
[1] 1.281552
Hence, z ∗ = 1.282.
2
Problem. Suppose that we have a random sample of 25 IQ scores of eight-graders in a city.
Suppose that the distribution of IQ scores among all eight-graders in that city is expected
3
to be Normal with unknown mean µ and known standard deviation of σ = 14. Here are the
scores:
107 110 99 131 123 83 143 129 102 72 97 100
118 103 110 90 132 110 139 93 101 102 107 96
92
Verify that the 25 scores do not depart too much from Normality by drawing a stemplot.
Then create a 99% confidence interval for the mean IQ score of all eight-graders in the city.
Solution. In R:
> IQ=c(107,110,99,131,123,83,143,129,102,72,97,100,92,118,103,110,90,132,
+ 110,139,93,101,102,107,96)
> stem(IQ)
The decimal point is 1 digit(s) to the right of the |
6
8
10
12
14
|
|
|
|
|
2
3023679
01223770008
39129
3
∗
We have 1 − α2 = 1 − 0.01
2 = 1 − 0.005 = 0.995, so we first want to find the critical value z
such that P (Z ≤ z ∗ ) = 0.995. Then we will find a 99% confidence interval. In R:
> IQ=c(107,110,99,131,123,83,143,129,102,72,97,100,92,118,103,110,90,132,
+ 110,139,93,101,102,107,96)
> z=qnorm(0.995)
> z
[1] 2.575829
> xbar=mean(IQ)
> xbar
[1] 107.56
> sdx =(14/sqrt(25))
> c(xbar-z*sdx,xbar+z*sdx)
[1] 100.3477 114.7723
We obtain from R that z ∗ = 2.576, x̄ = 107.56, and the 99% confidence interval is (100.35, 114.77).
Thus, we are 99% confident that the mean IQ of eight-graders in the city is between 100.35
and 114.77 points.
Problem. (For more advanced R-users). Create a function for computing the confidence
interval in the previous problem:
Solution. We will create a function that calculates the confidence interval for varying values
of the standard deviation, confidence level, and sample size:
> IQ=c(107,110,99,131,123,83,143,129,102,72,97,100,92,118,103,110,90,132,
+ 110,139,93,101,102,107,96)
4
> f=function(IQ,sigma,level,n){z=qnorm(level)
+ xbar=mean(IQ)
+ sdx =(14/sqrt(n))
+ c(xbar-z*sdx,xbar+z*sdx)}
> f(IQ,14,0.995,25)
[1] 100.3477 114.7723
Explanation. The code can be explained as follows:
• We create the function by the command function(){} and we add the variables IQ,
sigma, level, n to the function which we named f .
• We call the function f with the following values of the variables: IQ (is already defined),
sigma=14, level=0.995, and n=25, in f(IQ, 14, 0.995, 25).
The Margin of Error
The margin of error for a confidence interval is defined as:
σ
margin of error = critical value × standard error = z ∗ √ .
n
Thus, a confidence interval is on the form
estimate ± margin of error.
The margin of error decreases if:
• the standard deviation decreases. A low variation in the population reduces the standard error of the estimate.
• the sample size n increases. Increasing the sample size makes the estimate more precise.
• the confidence level decreases. Lowering the confidence level decreases the value of the
critical value z ∗ . Thus, we have to accept lower confidence if we would want to have a
lower margin of error.
Problem. Suppose that we have a simple random sample of size 10 from a large population
with unknown mean and known standard deviation σ = 9. Compute the margins of error for
95% confidence. Repeat the problem for sample sizes 40 and 160. What do you notice?
Solution. The margin of error is z ∗ √σn = 1.96 √9n . The critical value is found in the first
problem in this chapter.
For n = 10, the margin of error is 5.58.
For n = 40, the margin of error is 2.79.
For n = 160, the margin of error is 1.39.
Increasing the sample size by 4 reduces the margin of error to half of the value.
Note that usually the standard deviation σ is unknown. We will consider that situation in a
later chapter.
5


