Speed vs. Time Graph Matching
advertisement
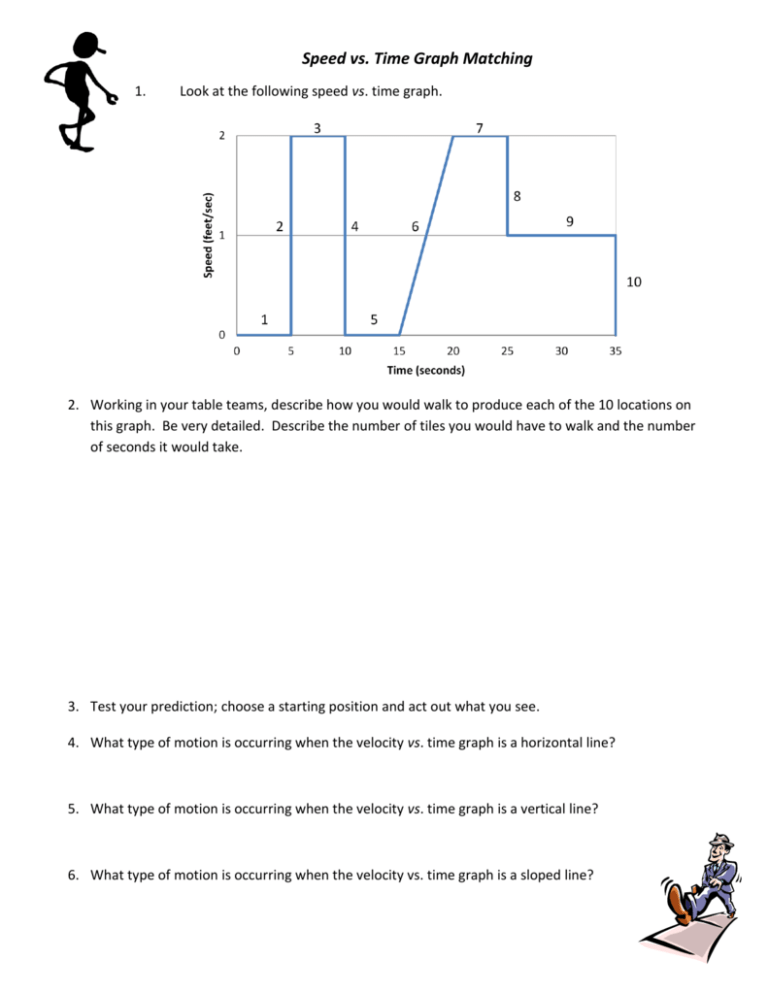
Speed (feet/sec) 2 Speed vs. Time Graph Matching 1 1. 0 Look at the following speed vs. time graph. 10 015 520 25 30 35 Time… 2. Working in your table teams, describe how you would walk to produce each of the 10 locations on this graph. Be very detailed. Describe the number of tiles you would have to walk and the number of seconds it would take. 3. Test your prediction; choose a starting position and act out what you see. 4. What type of motion is occurring when the velocity vs. time graph is a horizontal line? 5. What type of motion is occurring when the velocity vs. time graph is a vertical line? 6. What type of motion is occurring when the velocity vs. time graph is a sloped line? 7. Look at the following speed vs. time graph. Speed (feet/sec) 2 1 0 0 5 10 15 20 25 30 35 Time (seconds) 8. Working alone, describe how you would walk to produce this graph. Be very detailed. Describe the number of tiles you would have to walk and the number of seconds it would take.
