Figure 6-4-1 Approval of New Drugs See Table 6-4
advertisement
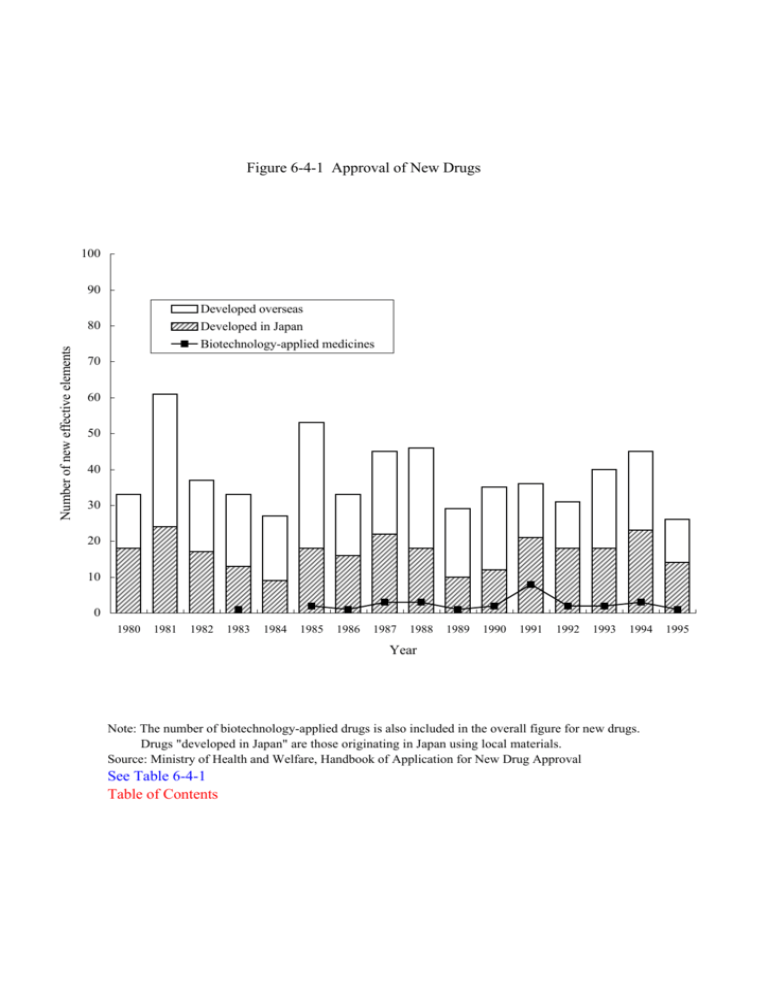
Figure 6-4-1 Approval of New Drugs 100 90 Developed overseas Developed in Japan Biotechnology-applied medicines Number of new effective elements 80 70 60 50 40 30 20 10 0 1980 1981 1982 1983 1984 1985 1986 1987 1988 1989 1990 1991 1992 1993 1994 Year Note: The number of biotechnology-applied drugs is also included in the overall figure for new drugs. Drugs "developed in Japan" are those originating in Japan using local materials. Source: Ministry of Health and Welfare, Handbook of Application for New Drug Approval See Table 6-4-1 Table of Contents 1995 Table 6-4-1 Approval of New Drugs (New Active Ingredients) Number of newly approved drugs Breakdown of newly approved drugs BiotechnologyDeveloped in Developed Year applied drugs Japan overseas 1980 33 18 15 1981 61 24 37 1982 36 17 20 1983 33 1 13 20 1984 26 9 18 1985 53 2 18 35 1986 33 1 16 17 1987 45 3 22 23 1988 45 3 18 28 1989 29 1 10 19 1990 33 2 12 23 1991 35 8 21 15 1992 31 2 18 13 1993 40 2 18 22 1994 45 3 23 22 1995 25 1 14 12 Notes: (1) The 1982, 1984,1988, 1990, 1991 and 1995 figures contain some ingredients which were developed both in Japan and overseas (i.e. overlaps). (2) Drugs "developed in Japan" mean those manufactured in Japan so that they include those originally developed overseas. Drugs "developed overseas" mean imported drugs. Source: Ministry of Health and Welfare, Handbook of Application for New Drug Approval

