Introduction to Statistics Term Project
advertisement

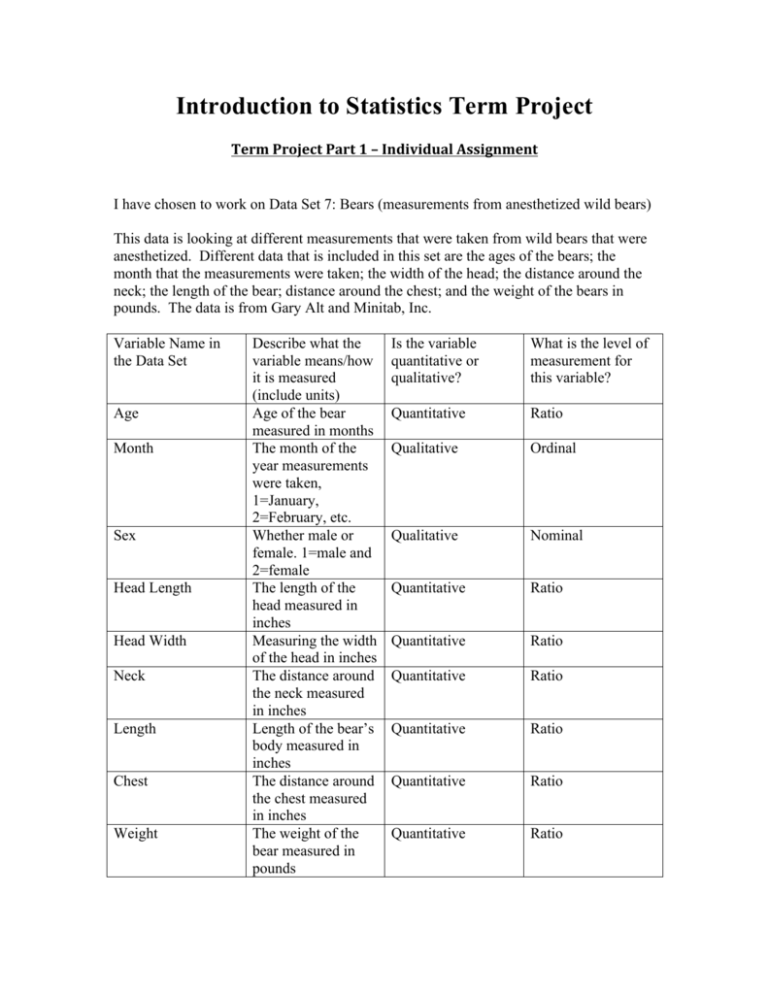
Introduction to Statistics Term Project Term Project Part 1 – Individual Assignment I have chosen to work on Data Set 7: Bears (measurements from anesthetized wild bears) This data is looking at different measurements that were taken from wild bears that were anesthetized. Different data that is included in this set are the ages of the bears; the month that the measurements were taken; the width of the head; the distance around the neck; the length of the bear; distance around the chest; and the weight of the bears in pounds. The data is from Gary Alt and Minitab, Inc. Variable Name in the Data Set Age Month Sex Head Length Head Width Neck Length Chest Weight Describe what the variable means/how it is measured (include units) Age of the bear measured in months The month of the year measurements were taken, 1=January, 2=February, etc. Whether male or female. 1=male and 2=female The length of the head measured in inches Measuring the width of the head in inches The distance around the neck measured in inches Length of the bear’s body measured in inches The distance around the chest measured in inches The weight of the bear measured in pounds Is the variable quantitative or qualitative? What is the level of measurement for this variable? Quantitative Ratio Qualitative Ordinal Qualitative Nominal Quantitative Ratio Quantitative Ratio Quantitative Ratio Quantitative Ratio Quantitative Ratio Quantitative Ratio Term Project Part 2 – Individual Assignment 1. Pie Charts and Pareto Charts for Simple Random Samples and Stratified Samples Term Project Part 3 – Individual Assignment 1. Sample Statistics Simple random sample of weight (lbs) Unit of measurement is lbs. Mean: 186 Standard Deviations: 124.129 Min: 26 Q1: 79 Median: 166 Q3: 262 Max: 514 Stratified sample of weight (lbs) by sex Unit of measurement is lbs. Mean: 178.829 (rounded to three decimals) Standard Deviations: 112.267 (rounded to three decimals) Min: 29 Q1: 94 Median: 150 Q3: 220 Max: 446 2. Frequency Histograms and Boxplots of samples 3. The shapes of both frequency histograms are skewed right. When comparing the minimum weight of the simple random sample compared to the population, they both have a minimum weight of 26 and maximum weight of 514; whereas, the stratified sample has a minimum weight 29 and maximum weight of 446. This also shows that when broken down into the stratified sample that the range of weights is smaller compared to the same sample size for the simple random sample. The highest frequency of weights of the bears in the population data set was around the classes of 26-­‐123 lbs and 124-­‐221 lbs. For the simple random data the highest frequency of weights for bears was around the classes of 50-­‐99 lbs, which is the same as the population data set and 200-­‐249 lbs, which does go outside the population data set. For the stratified sample data set it shows the highest frequency of weight of bears around 100-­‐149 lbs, which lies in the same weight classes as the population data set. Term Project Part 4 Individual Portion 1. By using a 95% confidence level, I am confident that 95% of the time that the interval 0.1856 to 0.5002 actually does contain the true value of the population proportion. 2. By using a 95% confidence level, I am confident that 95% of the time that the interval 143.4 to 228.6 actually does contain the true value of the population mean. 3. By using a 95% confidence level, I am confident that 95% of the time that the interval 105.6 to 176.6 actually does contain the true value of the population standard deviation. 4. a. By taking the number of bears captured in September and dividing them from the total number of bears that were captured in a year, I found that the percentage was 29.63%. The population proportion confidence interval is 0.1856 to 0.5002. Therefore, the confidence interval captures the population parameter. b. By finding the mean of the weights of the total bears that were captured, I found the mean was 182.88889. The population mean confidence interval is 143.4 to 228.6. Therefore, the confidence interval captures the population parameter. c. By finding the standard deviation of the total bears that were captured, I found the standard deviation was 121.80121. The population standard deviation confidence level is 105.6 to 176.6. Therefore, the confidence interval captures the population parameter. Term Project Part 5 Individual Portion 1. I am choosing a level of significance α 5% 2. The claim I am going to test is that 70% of the bears that were anesthetized were captured in the month of September. a. Null Hypothesis: H₀: p = .70 b. Alternative Hypothesis: H₁: p ≠ .70 c. Test Statistic: Z = !!! !" ! i. 𝑝 = 12/35 = .34 ii. Z = !.!"!!.!" !.!" !.!" !" = -­‐4.65 d. P-­‐value = 0.00000402 e. The conclusion is that I am going to reject the null hypothesis H₀: p=.70 because the P-­‐value = 0.0000 which is less than α 0.05. 3. The claim I am going to test is that the population mean for anesthetized bears was 175 lbs using a significance level of 5%. From the simple random sample of 35 bears, the sample mean is 186 and the sample standard deviation is 124.12897. a. Null Hypothesis: H₀: μ = 175 lbs b. Alternative Hypothesis: H₁: μ ≠ 175 lbs c. Test Statistic: t = !!!! ! ! i. 𝑥 = 186 ii. 𝑠 = 124.12897 iii. !"#!!"# !!".!"#$% !" = 0.5243 d. P-­‐value = 0.6035 e. The conclusion is that I am going to fail to reject the null hypothesis H₀: μ = 175 lbs because the p-­‐value is more than α 0.05. 4. A. The sample data does not support the claim that 70% of anesthetized bears were captured in the month of September. B. There is not sufficient evidence to warrant rejection of the claim that the population mean of the bears that were anesthetized is 175 lbs.


