Graphs of Linear Equations in Two Variables
advertisement
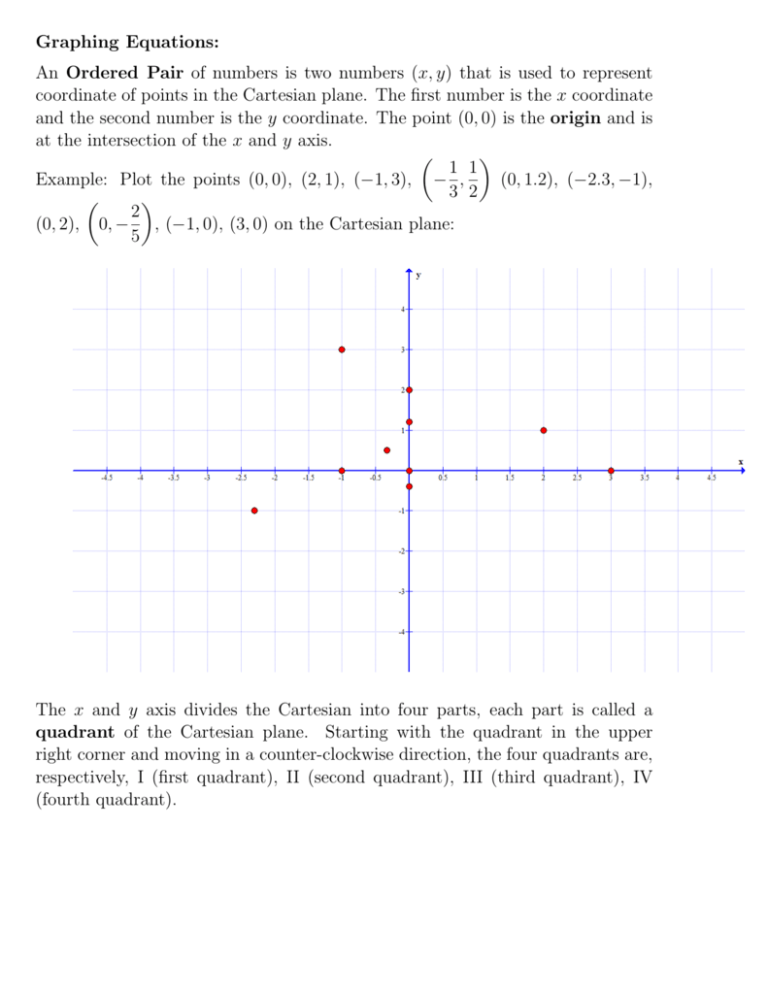
Graphing Equations: An Ordered Pair of numbers is two numbers (x, y) that is used to represent coordinate of points in the Cartesian plane. The first number is the x coordinate and the second number is the y coordinate. The point (0, 0) is the origin and is at the intersection of the x and y axis. 1 1 Example: Plot the points (0, 0), (2, 1), (−1, 3), − , (0, 1.2), (−2.3, −1), 3 2 2 (0, 2), 0, − , (−1, 0), (3, 0) on the Cartesian plane: 5 The x and y axis divides the Cartesian into four parts, each part is called a quadrant of the Cartesian plane. Starting with the quadrant in the upper right corner and moving in a counter-clockwise direction, the four quadrants are, respectively, I (first quadrant), II (second quadrant), III (third quadrant), IV (fourth quadrant). y II I x III IV For example, (2, 3) is a point in the first quadrant, (−2, −4) is a point in the third quadrant. Given an equation in two variables, x and y, the solutions to the equation can be represented as (x, y), where the first coordinate is the x value and the second coordinate is the y value that makes the equation true. When we do that, each solution (x, y) can now be viewed as a point on the Cartesian plane. If we plot all the solutions in ordered pair form (x, y) as points on the Cartesian plane, we get the graph of the equation. E.g. Graph x + y = 1 One way to graph an equation in two variables, if we know nothing about the equation, is to just plot points. We pick different values of x and solve the equation for y: For example, if x = 1, then y = 0, if x = 2, then y = −1, if x = 3, then y = −2 x y 0 1 1 0 −1 2 2 −1 −2 3 3 −2 If we plot all these ordered pair of points on the Cartesian plane, we get the graph of a line. The above equation is a linear equation. Linear Equation in Two Variables: The Standard Form of a linear equation in two variables is an equation of the form: ax + by = c, where a, b, c are all real numbers and a and b are not both zero. Example of linear equations in standard form: 3x + 4y = 6. In this example, a = 3, b = 4, and c = 6, this is a linear equation. x − 2y = −1 In this example, a = 1, b = −2, c = −1, this is a linear equation. −x + 3y = 0 In this example, a = −1, b = 3, c = 0, this is a linear equation. x=5 In this example, a = 1, b = 0, c = 5, this is a linear equation. Notice that we still have a linear equation as long as one of the x or y variable has a non-zero coefficient. 2y = −7 In this example, a = 0, b = 2, c = −7, this is a linear equation. Example: −3y = x + 9. This equation is not in standard form, but if we subtract x from both sides of the equation, we end up with −x − 3y = 9. This is a linear equation. The reason an equation of this form is called a linear equation is because its graph is a straight line. We can graph an by plotting point. If we know that we have a linear equation, then we only need two points on the line in order to graph the line. Example: Graph the equation 2x + y = 1 This is a linear equation. We need to plot two points on the line. We can arbitrarily choose an x value then solve for y, or choose an y value then solve for x in the equation. For example, if we choose x = 1 (This choice is arbitrary, we could have used any value for x then solve the equation for y. Of course, we usually choose numbers that are easy to work with.), then the equation becomes: 2(1) + y = 1 ⇒ 2 + y = 1 ⇒ y = −1 So (1, −1) is a point on the line. We can also choose a y value and solve for x. For example, we can choose y = 0, this gives us: 1 2x + 0 = 1 ⇒ 2x = 1 ⇒ x = 2 1 , 0 is another point on the line. So 2 We can then plot these two points on the Cartesian plane, and connect the two points with a straight line. This straight line is the graph of the equation: Example: Graph the equation 2x − 3y = 6 We use the same method as before, by plotting two points on the graph. We can choose x = 0 to solve for y, we get: 2(0) − 3y = 6 ⇒ −3y = 6 ⇒ y = −2 So (0, −2) is a point on the line. We may choose y = 0 to solve the equation for x: 2x − 3(0) = 6 ⇒ 2x = 6 ⇒ x = 3 So (3, 0) is a point on the line. We plot these two points and connect them with a straight line, this gives us the graph of the equation: Notice that the point (3, 0) is a point on the line where the line intersects the x−axis. This point is called the x-intercept of the line because it is where the line intercepts the x−axis. In general, the x−intercept of a line, if it exists, always has its y−coordinate equal to 0. The point (0, −2) is a point on the line where the line intersects the y−axis. This point is called the y-intercept of the line because it is where the line intersects the x−axis. In general, the y−intercept of a line, if it exists, always has its x−coordinate equal to 0. You should understand that both the x and y intercepts are points. Therefore, formally an intercept should be expressed as an ordered-pair of numbers. However, since we understand that an x−intercept always has its y−coordinate being equal to zero, and y−intercept always has its x−coordinate equal to zero, it is acceptable to refer to an intercept with just one number. For example, we may say that a line has an x−intercept of 5. What we actually meant is that the x−intercept of the line is the point (5, 0), since we understand that the y coordinate of an x−intercept is 0. Similarly, we may say that the y−intercept of a line is −4, what we meant is that the y−intercept of the line is the point (0, −4), understanding that the x coordinate of an y−intercept is 0. In graphing a linear equation, we can use any two points on the line. However, since the x and y intercepts are two points easily recognized on the graph, and the number 0 is easy to work with, sometimes we like to use the x and y intercept as the two points on the graph to draw the line. Example: Given the equation 3x + 2y = 7, find the x and y intercept of this line, and graph this line. Ans: By definition, x−intercept is where the y−coordinate is equal to 0. Therefore, to find the x−intercept of a line, we set y = 0 in the equation and solve for x: 7 3x + 2(0) = 7 ⇒ 3x = 7 ⇒ x = 3 7 The x−intercept is the point ,0 3 By definition, y−intercept is where the x−coordinate is equal to 0, so to find the y−intercept, we set x = 0 in the equation and solve for y: 7 3(0) + 2y = 7 ⇒ 2y = 7 ⇒ y = 2 7 The y−intercept is the point 0, 2 We can use the two intercepts to graph the line: Example: Find the x and y intercept of the line x = 3, and graph the line. Ans: In order for this equation to be true, x must have a value of 3. What about y? Since the equation does not have y at all, this means that y is a free variable, meaning that y can be any (real) number and the equation will still be true as long as x is equal to 3. For example, if x = 3 and y = 1, the equation is true, so (3, 1) is a point on this line. If x = 3 and y = −1, the equation is ture, so (3, −1) is also a point on this line. In fact, any point of the form (3, y) where y is any real number, will be a point on the line. If we plot the two points (3, 1), (3, −1) and connect them with a straight line, we see that the resulting line is a vertical line. In general, any equation of the form x = c, where c is a constant, is a vertical line. Notice that this line is parallel to the y−axis, so it will not intersect the y−axis. This means that this line does not have a y−intercept. In general, a vertical line does not have a y−intercept (unless it is the y−axis itself). Algebraically, since a y−intercept by definition is where x = 0, but in order for the equation x = 3 to be true, x cannot equal 0, that’s why there is no y−intercept. Since the equation is true as long as x = 3, and y can be any number, the point (3, 0) is a point on the line. In other words, (3, 0) is the x−intercept. Example: Find the x and y intercept of the line y = 2, and graph the line. Ans: This time, the equation does not contain x, which means that x can be any real number, as long as y = 2. For example, (−3, 2), (1, 2) are points on the line, among other points of the form (x, 2). If we plot these points on the Cartesian plane and connect them with a straight line, we see that the resulting graph is a horizontal line. In general, any equation of the form y = c, where c is a constant, is a horizontal line. This line is parallel to the x−axis, so it will not intercept the x−axis, meaning that a horizontal line does not have an x−intercept. In the equation y = 2, since x could be equal to any number, we can set x = 0, so (0, 2) is a point on the line. This is the y−intercept. Slope of a line Given any two points (x1 , y1 ) and (x2 , y2 ) on a line, the slope of the line is defined by: y2 − y1 m= x2 − x1 Example: Find the slope of the line containing the points (1, 4), (−2, 3) −1 1 3−4 = = m= −2 − 1 −3 3 1 The slope of the line is 3 The slope of a general line represents the change of y divided by change of x. In other words, the slope of a line represents the amount of changes in y for each unit increase in x. For example, a slope of 2 means that, for each unit increase in x, y increases by 2. A slope of 1/2 means that, for each unit increase by x, y increases by only 1/2. A negative slope means that y decreases as x increases. For example, a slope of −3 means that, for each unit increases in x, y decreases by 3 units. When a linear equation is used as a model for two different quantities x and y in an application, the slope of the line tells us the relationship between the changes in y corresponding to the changes in x. For example, suppose we use a linear equation to model the average annual income of an individual as the y value, and the x value represents the number of years of college education the person has, we would expect that the line has a positive slope. This means that the annual income of a person increases as his/her number of years of education increases. annual income (10K) num of yrs of college education On the other hand, suppose a linear equation is used to model the resale value of a used car as the y value, and the x value represents the number of years the car has been driven, then we would expect this line having a negative slope, meaning that the older the car, the lower its resale value. Geometrically, the slope of a line is described as rise over run. What this measures is the slantedness of the line. The larger the magnitude of the slope, the more slanted (close to vertical) the line is; the smaller the magniture of the slope, the less slanted (close to horizontal) the line is. If the slope is positive, the line tilts southwest to northeast, if the slope is negative, the line tilts northwest to southeast. l4 l3 l2 l5 l1 In the picture above, l1 , l2 , l3 all have positive slope, and l4 , l5 have negative slope. Slope of l3 is greater than slope of l2 , which is in turn greater than slope of l1 . Slope of l4 is more negative than slope of l5 . If we let m1 , m2 , m3 , m4 , m5 be the slope of l1 , l2 , l3 , l4 , l5 , respectively, then m4 < m5 < 0 < m1 < m2 < m3 Example: Find the slope of the line that contains that two points (−1, −2) and (5, −2) Ans: We use the formula for slope to find the slope of the line: −2 − (−2) −2 + 2 0 m= = = =0 5 − (−1) 5+1 6 The slope of this line is 0. If we draw the straight line that contains these two points, we noticed that the line is a horizontal line. This is true in general. The slope of a horizontal line is always equal to 0, and any line with a slope of 0 is a horizontal line. Example: Find the slope of the line that contains the two points (4, −3) and (4, 1) Ans: We again use the formula for slope: 1 − (−3) 1 + 3 4 = = = undefined. m= 4−4 4−4 0 Since the expression for the slope of the line involves division by 0, the result is undefined. If we graph the straight line that contains these two points, we noticed that the line is a vertical line. This is true in general. The slope of a vertical line is undefined, and any line with an undefined slope must be a vertical line. If we are given the equation of a line instead of two points on the line, we can still find the slope of the line. One way to do so is to just come up with two points on the line first: Example: Find the slope of the line 2x + 3y = 5 Ans: We can come up with any two points on the line by picking an x value and solve for y (or picking a y value and solve for x): If we set x = 1, then the equation gives: 2(1) + 3y = 5 ⇒ 2 + 3y = 5 ⇒ 3y = 3 ⇒ y = 1 So (1, 1) is a point on the line. If we set y = 3, then the equation gives: 2x + 3(3) = 5 ⇒ 2x + 9 = 5 ⇒ 2x = −4 ⇒ x = −2 So (−2, 3) is another point on the line. If we use the formula for slope, we have: 1−3 −2 2 m= = =− 1 − (−2) 3 3 We can also find the slope of a line using the Slope Intercept Form: Defintion: The equation y = mx+b, where m, b are constants, is called the slope-intercept form of the equation of a line. When the equation of a line is expressed in this format, m is the slope and b is the y−intercept. Example: y = 3x + 4 This equation is in slope-intercept form, the slope is m = 3, and the y−intercept is b = 4. Example: y = −2x − 1. This equation is in slope-intercept form, the slope is m = −2, and the y−intercept is b = −1. Example: y = x − 3 This equation is in slope-intercept form, the slope is m = 1, and the y−intercept is b = −3. Example: y = 4x This equation is in slope-intercept form, the slope is m = 4, and the y−intercept is b = 0. Notice that in this example, since there is no constant term, it is understood that the constant is 0, which is the y−intercept. Example: y = −6 This equation is in slope-intercept form, the slope is m = 0, and the y−intercept is b = −6. Notice that in this example, there is no variable x, it is understood that the reason for this is because the coefficient of x, which is the slope m, is 0. Notice that this is a horizontal line. Example: y = 0 This equation is in slope-intercept form. The slope is m = 0 and the y−intercept is b = 0. Notice that this is a horizontal line. In fact, this line is the x−axis. Example: Find the slope and y intercept of the line 3x + 4y = 1 Ans: This equation is not in slope-intercept form. In order to find the slope and y−intercept, we would want to change the equation to slope intercept form first. We can do that by isolating y: −3x + 1 3 1 3x + 4y = 1 ⇒ 4y = −3x + 1 ⇒ y = =− x+ 4 4 4 3 With the equation in slope-intercept form, we can see that the slope is m = − 4 1 and y−intercept is b = . 4 Example: Find the slope and y−intercept of the line x = 10 Ans: This equation is not in slope-intercept form, and it is not possible to change this equation to slope-intercept form. This is the equation of a vertical line. A vertical line has an undefined slope, therefore it cannot be put into slope-intercept form. In general, the equation of a vertical line cannot be put into slope-intercept form. To graph a line in slope intercept form, we may first locate the y intercept on the graph, then move according to the slope. Finding Equations of Lines Given enough information about a line (two points, or a point and the slope), we can find the equation of a given line: Point-Slope Form of the equation of a line: y − y1 = m(x − x1 ) This form is nothing more than a restatement of the definition of the slope. This form is most convenient to use in order to find the equation of a line when we have the slope m and a point (x1 , y1 ) on the line. Example: Find the equation of the line with slope −3 and containing the point (−2, 4) We may put it in point-slope form since we already have a point and a slope: y − 4 = −3(x − (−2)) y − 4 = −3(x + 2) y − 4 = −3x − 6 y = −3x − 2 Example: Find the equation of the line containing the points (−3, 4) and (−2, −6) We first find the slope of the line: −6 − 4 −10 −10 m= = = = −10 −2 − (−3) −2 + 3 1 With the slope, we may use the point-slope form again: y − 4 = −10(x − (−3)) y − 4 = −10(x + 3) y − 4 = −10x − 30 y = −10x − 26 Example Find the equation of the vertical line containing the point (3, 5) Answer: All points on a vertical line have the same x-coordinate, so the equation is x = 3 Example: Find the equation of the horizontal line containing the point (2, 7) Answer: All points on a horizontal line have the same y-coordinate, so the equation is y = 7 In general, any vertical line has an quation of the form x = a, where a is the x-coordinate of any point on the line. In general, any horizontal line has an quation of the form y = b, where b is the y-coordinate of any point on the line.

