Microphotometric determination of hematocrit in small vessels
advertisement
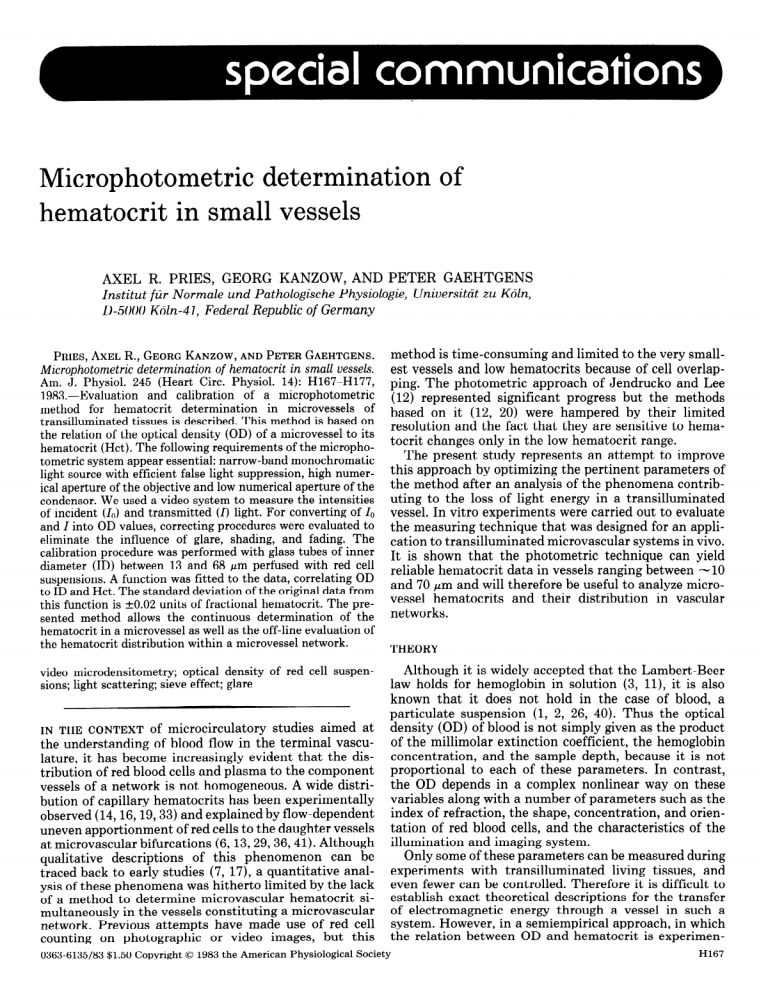
Microphotometric determination hematocrit in small vessels AXEL R. PRIES, GEORG KANZOW, of AND PETER Institut fiir Normale und Pathologische Physiologie, D-5000 K&z-41, Federal Republic of Germany PRIES,AXEL R., GEORGKANZOW,ANDPETERGAEHTGENS. Microphotometric determination of hematocrit in small vessels. Am. J. Physiol. 245 (Heart Circ. Physiol. 14): H167-H177, 1983.-Evaluation and calibration of a microphotometric method for hematocrit determination in microvessels of transilluminated tissuesis described.This method is basedon the relation of the optical density (OD) of a microvesselto its hematocrit (Hct). The following requirementsof the microphotometric systemappear essential:narrow-band monochromatic light sourcewith efficient false light suppression,high numerical aperture of the objective and low numerical aperture of the condenser.We useda video system to measurethe intensities of incident (lo) and transmitted (I) light. For converting of lo and I into OD values, correcting procedureswere evaluated to eliminate the influence of glare, shading, and fading. The calibration procedure was performed with glasstubes of inner diameter (ID) between 13 and 68 pm perfused with red cell suspensions.A function was fitted to the data, correlating OD to ID and Hct. The standard deviation of the original data from this function is to.02 units of fractional hematocrit. The presented method allows the continuous determination of the hematocrit in a microvesselaswell as the off-line evaluation of the hematocrit distribution within a microvesselnetwork. GAEHTGENS Universitdt zu K&a, method is time-consuming and limited to the very smallest vessels and low hematocrits because of cell overlapping. The photometric approach of Jendrucko and Lee (12) represented significant progress but the methods based on it (12, 20) were hampered by their limited resolution and the fact that they are sensitive to hemaa tocrit changes only in the low hematocrit range. The present study represents an attempt to improve this approach by optimizing the pertinent parameters of the method after an analysis of the phenomena contributing to the loss of light energy in a transilluminated vessel. In vitro experiments were carried out to evaluate the measuring technique that was designed for an application to transilluminated microvascular systems in vivo. It is shown that the photometric technique can yield reliable hematocrit data in vessels ranging between -10 and 70 pm and will therefore be useful to analyze microvessel hematocrits and their distribution in vascular networks. THEORY Although it is widely accepted that the Lambert-Beer video microdensitometry; optical density of red cell suspensions;light scattering; sieve effect; glare law holds for hemoglobin in solution (3, ll), it is also IN THE CONTEXT of microcirculatory studies aimed at the understanding of blood flow in the terminal vasculature, it has become increasingly evident that the distribution of red blood cells and plasma to the component vessels of a network is not homogeneous. A wide distribution of capillary hematocrits has been experimentally observed (14,16,19,33) and explained by flow-dependent uneven apportionment of red cells to the daughter vessels at microvascular bifurcations (6,13,29,36,41). Although qualitative descriptions of this phenomenon can be traced back to early studies (7, 17), a quantitative analysis of these phenomena was hitherto limited by the lack of a method to determine microvascular hematocrit simultaneously in the vessels constituting a microvascular network. Previous attempts have made use of red cell counting on photographic or video images, but this 0363-6135/83 $1.50 Copyright 0 1983 the American Physiological Society known that it does not hold in the case of blood, a particulate suspension (1, 2, 26, 40). Thus the optical density (OD) of blood is not simply given as the product of the millimolar extinction coefficient, the hemoglobin concentration, and the sample depth, because it is not proportional to each of these parameters. In contrast, the OD depends in a complex nonlinear way on these variables along with a number of parameters such as the index of refraction, the shape, concentration, and orientation of red blood cells, and the characteristics of the illumination and imaging system. Only some of these parameters can be measured during experiments with transilluminated living tissues, and even fewer can be controlled. Therefore it is difficult to establish exact theoretical descriptions for the transfer of electromagnetic energy through a vessel in such a system. However, in a semiempirical approach, in which the relation between OD and hematocrit is experimenH167 PRIES, KANZOW, H168 tally determined, theory could be used to optimize the controllable parameters and help to understand and process the data. The most prominent phenomenon occurring in particulate suspensions in contrast to solutions is the scattering of light. In the case of blood, light scattering can be attributed to 1) reflection and deflection of light at the blood cell surface or inner structures, 2) diffraction of light by the red blood cells (Huygens principle), and 3) interference effects due to a phase shift of light passing the red blood cells. Inasmuch as blood cells are large compared with the wavelength of light and their refractive index differs little from that of the embedding medium, they can be considered as large, tenuous scatterers (39). For a suspension of such particles Twersky (37-39) has developed a formalism that describes the OD of a transilluminated sample (OD,,,) as the sum of the ODs caused by absorption (OD& and by scattering (OD,,,) of the incident light OD sus= ODabs + (1) ODsca This is explicitly given by Twersky as OD sus= red - log,, [ lo-“d’H”t - HCt’) + q (l-lo-Sd’Hct - Hct2’]] 10 (1 - Hct) + I0 Hct TP that is transmitted through it. The OD of such a layer (OD,& can then be calculated as OD abs += - loglo [ 1 - Hct (1 - TJ] (4 The difference between the absorption of a solution (OD,,l) and that of a particulate suspension (ODabs) containing the same amount of absorbing substance is called “sieve” effect (30) and must be accounted for if the optical density of a suspension such as blood is investigated (18, 22). Therefore the substitution of ODabs by the term Ecd (equal to OD&, which is implicitly done in Eq. 2, is insufficient. Duysens (8) derived ODabs for m layers of randomly distributed, cubical particles OD abs -n-z loglo [l - Hct (1 - TP)] (5) This is identical to the ODabs+ of a single layer (as given in Eq. 4) multiplied by the number of layers. Figure 1 serves to illustrate these theoretical considerations. Figure 1A shows the absorption spectrum (OD,,l vs. X) of an oxygenated hemoglobin solution as measured in a recording spectrophotometer (Beckman ratio-recording spectrophotometer). In addition, the optical density of a red cell suspension (OD,,,) of identical hemoglo= (2) where c is extinction coefficient (quarter millimolar) of hemoglobin; c is hemoglobin concentration; d is sample depth; red = OD,,l is the OD of a hemoglobin solution according to the Lambert-Beer law; s is scattering coefficient, depending on the relative refraction index of the red blood cells (v’ ), their dimensions, and the wave length (X) of the incident light in the suspending medium; Hct is hematocrit, particle volume fraction in the suspension; and 4 is fraction of the scattered light flux that is detected by the photosensing system, depending on q’, X, the particle dimensions, and the aperture half angle (y) of the photosensor. All reflected and scattered flux into the back half space of the sample is neglected (38, 39), and it is thereby assumed that 4 = 1 for an aperture half angle of 90”. From Eqs. 1 and 2 it can be deduced that I) OD,b, equals the OD of a hemoglobin solution with identical hemoglobin concentration (OD,,l). 2) OD,,, equals 0 if q = 1 or s = 0 or Hct = 1. 3) In the formalism of Eq. 2 independent changes of OD,b, and OD,,, are not impossible, e.g., changes in 6 without concomitant changes in r’ and X will not influence OD,,,. 4) OD,,, is governed by the parabolic function (Hct - Hct2) and shows a maximum at Hct = 0.5. 5) OD,,, > OD,,l. A simple thought experiment, described by Duysens (8), shows that deduction 1 cannot be true. Consider the case of a light beam incident on a monolayer of dispersed, homogeneous, cubical particles that absorb but do not scatter light. If the particles are each oriented with one of their walls perpendicular to the incident light beam, the transmitted flux (I) through the layer is given by I= AND GAEHTGENS co where lo is the light intensity incident on the layer and Tp is the fraction of the light incident on a single particle 0 300 500 h,nm A,nm FIG. 1. A: optical density of an oxygenated hemoglobin solution (solid line, OD,,J and that of a red cell suspension (broken lines) vs. light wave length X. Suspension spectra were recorded with an aperture half angle (y) of approximately 1” (OD,,“) and approximately 40” (OD,,,). Hemoglobin concentration was 0.017 g/d1 in all samples. B: absorption component (solid line, OD,,,,) and scattering component (broken line, OD,,) of suspension spectrum OD,,, from A. C: magnitude of sieving effect (solid line, Asie) and difference between optical densities of suspension and solution (broken line, A,,) as function of X. MICROPHOTOMETRIC DETERMINATION OF HEMATOCRIT H169 bin concentration as function of the light wavelength (X) is given for a photodetector aperture (y) of approximately 1 O (ODsus*) and approximately 40” (OD,,,), respectively. The latter aperture angle was achieved by placing diffusing plates directly behind the measuring and reference cuvettes (35). Thereby an important part of the scattered light flux was collected and could be detected by the photosensor. While the spectrum of the oxyhemoglobin solution shows the well-known shape (3, 11) with pronounced absorption bands, the suspension spectrum obtained with the usual small photometric aperture angle is flattened and the extinction maxima are shifted to longer wavelengths. This is consistent with both theoretical and experimental reports in the literature (18, 31, 39). With an increased photometric aperture angle the predominance of scattering is reduced, and therefore the resulting spectrum is less distorted (15, 18). This spectrum will be used for the following analysis as it is similar to the spectrum that would be obtained with a microscope where the “photometric aperture angle” in mainly determined by the numerical aperture of the objective. According to Eq. 1 this spectrum can be decomposed into an absorption and a scattering component (Fig. 1B). ODabs, which is independent of the aperture angle, was calculated from Eq. 5. Thereto, Tp was derived from the red cell volume, the hemoglobin concentration within the red cells, and c, assuming-a cubical cell shape. Values of e were taken from the data of ODSOl in Fig. lA, whereas w1was calculated by dividing the sample depth d by the edge length of the particles. OD,,, is then obtained as the difference between OD,b, and OD,,,. Other investigators have reported spectra of red cell suspensions obtained after experimental correction for scattering (5, 18) and sieve effect (18). These spectra and the correction spectra are qualitatively comparable to the curves shown in Fig. 1. OD,b, deviates appreciably from ODsolonly at absorpshown in Fig. 1C by tion maxima, as is quantitatively the Asie curve, where A sie = OD abs - OD sol (6) The scattering spectrum, in contrast, exhibits an inverse behavior with ODsca minima corresponding to maxima of ODsol or ODabs- It is noteworthy that the difference between the optical density of a red cell suspension and that of its hemolysate (A,,,) is not always positive, as is shown in Fig. 1C. Atot becomes negative if c assumes very high values (23, 31). This finding, which is in contrast to Twersky’s theoretical treatment (see Eq. 2 and deduction 5), can only be explained if it is understood that the spectrum of the suspension is not only influenced by light scattering, which leads to an increase in optical density, but also by the sieve effect, which reduces optical density. In the present analysis, any possible interaction between these two effects is neglected and thus Eq. 1 OD sus= ODabs + ODsca (1) is used but now accounts for the sieve effect in evaluating using OD abs,which was calculated from Eq. 5 implicitly the cubical cell model. Whereas the assumption of independence between ODabs and ODs,a (see Eq. 2, deduction 3) simplifies the qualitative interpretation of OD,,, spectra, it is certainly not adequate for obtaining exact solutions of the problem. For example, the increase of effective optical path length caused by the scattering properties of a suspension will alter the light attenuation by absorption. It was not possible to calculate ODsca from Eq. 2 since not all necessary parameters of the suspension and the measuring system are known. Therefore theory and experiment could not be quantitatively compared. MATERIALS AND METHODS For the calibration of the hematocrit measuring technique, small-bore glass tubes of 3-cm length with inner diameters (ID) ranging from 13 to 68 pm were used. Diameters were measured end on with the capillary tube mounted vertically. Each capillary was then mounted on a glass slide; one end reached approximately 1 cm over the edge of the slide and the other was glued into a microhematocrit tube. This assembly was then placed horizontally on the stage of a microscope (Leitz). The capillary was immersed in oil of appropriate refractive index and transilluminated using Kohler illumination conditions. The free. end of the capillary was inserted into one of a series of syringes that were used as feed reservoir. The syringes were filled with hemoglobin solutions or suspensions of red blood cells (RBC) in KrebsRinger solution that were stirred immediately prior to measurement. A negative pressure was applied to the downstream end of the microhematocrit tube to generate flow through the capillary. The center-line velocity generally exceeded 2 mm/s. Blood was obtained by exsanguination of heparinized Wistar rats through a carotid catheter. After centrifugation and removal of the buffy coat, RBC suspensions were prepared by adding various amounts of KrebsRinger solution to the packed cells. Hematocrits in the feed reservoir were determined by the microhematocrit method without correction for trapped plasma. Hemoglobin solutions were prepared by adding 300 ~1 of saponin solution (16 g/l00 ml) to 10 ml of packed cells. Following filtration (Millipore filter, 1.2~pm pore diam) the hemoglobin concentration of the solution was adjusted by adding various amounts of distilled water and determined using the cyanmethemoglobin method. Full oxygen saturation of all samples was achieved by equilibration with room air. Percent saturation as well as the absence of methemoglobin and CO-hemoglobin was checked with an IL 282 oximeter (Instrumentation Laboratory). To be able to derive the tube hematocrit (HctT) from the known hematocrit in the feed reservoir (HctF), a preliminary set of experiments was performed. Glass tubes of appropriate diameters were perfused at various HctF values, ranging from 0.1 to 0.88 and sealed with epoxy resin after the flow was suddenly stopped (9). No significant differences were seen between the discharge hematocrit and HctF. Hctr values were then determined H170 PRIES, after centrifugation of the tubes at 12,000 g for 10 min. The ratio HctT/HctF as a function of the feed hematocrit was fitted for each tube diameter separately by linear regression lines, the parameters of which are given in Table 1. The light intensities 10 and I were determined on a video image of the glass tubes perfused with KrebsRinger solution or the sample under investigation. The OD signals were integrated over a period of at least 1 s. The 1.0 rectangular measuring window was positioned over the tube center line, its edge length being adjusted to approximately one-third of the tube diameter. DISCUSSION AND GAEHTGENS nm ODsus OF METHODS The applicability of the method for hematocrit determination using OD measurements of transilluminated microvessels requires the optimization of some methodical parameters, which are discussed in the following sections. WaveLength. The first parameter to choose is X and implicitly E. For spectrophotometry it can be calculated that the measurement will be most accurate if OD is approximately 0.4, and an acceptable small error is achieved in the OD range between 0.15 and 1.0 (3). If this rule is adopted for measurements of hemoglobin in concentrations from 0 to 20 g/d1 in vessels with diameters between 10 and 50 pm, X should be chosen as to provide an 6 of about 20. This guideline is not directly applicable to a suspension of RBCs as the absorption in the suspension is lower than that in the corresponding solution due to the sieve effect, especially near the Soret band, while there is an additional loss of light intensity caused by scattering. For the precision of hematocrit measurement, the relative magnitudes of OD,,, and OD,b, are more important than the absolute OD range because their individual relationships to the hematocrit are quite different. Figure 2 shows OD,,, and the two calculated components constituting OD as functions of hematocrit. These measurements were performed with a 35pm cuvette in a spectrophotometer (Zeiss PMQ II) at a wavelength of 448 nm. While ODabs, calculated from Eq. 5, increases almost proportionally with hematocrit, which is favorable for the hematocrit determination, OD,,, shows a parabolic shape with a steep increase at low HctT and almost constant values between hematocrits of 0.25 and 0.75. This finding is consistent with other experiments reported in the literature (1, 22) and also with Twersky’s TABLE 1. Regressionparameters for functions correlating HctT/HctF to HctF with HctT/HctF = m HctF + b IQ pm 13 26 34 47 68 m 0.36 0.40 0.44 0.26 0.16 b 0.50 0.52 0.73 0.85 Hctr, tube inner diameter. A =448 KANZOW, hematocrit; HctF, 0.54 hematocrit from feed reservoir; ID, 0 0 1 0.2 1 1 1 0.4 I 0.6 1 ‘\ 0.8 Hctr FIG. OD,b, depth 2. Hematocrit dependence of OD,, and its two and OD,, as determined in a spectrophotometer of 35 pm. Abbreviations in Fig. 1. theoretical treatment components at a sample of the scattering process (Eq. 2, as the shape of the curve relating OD,,, to Hctr impairs hematocrit measurements except at very low cell concentrations, the relative magnitude of the absorption component must be rendered as high as methodically feasible even if the spectrophotometric rule cited above is violated in doing this. Figure 1B has already shown that the absorption share of OD,,, increases with increasing c (33). Thus four isosbestic wavelengths can be considered; i.e., 398 nm (c = 56), 422 (t’ = 113),448 (c = 19), and 548 (E = 12.5). The application of the 398nm and especially the 422-nm wavelength is restricted to low hematocrits and small vessels if a reasonable upper OD limit of 2.3 (light attenuation 2OO:l) is fixed. Therefore we chose to establish the relation between OD,,, and HctT at a X of 448 nm. It is necessary, as in all photometry, to use sufficiently monochromatic light for the measurements. For the wavelength chosen, the use of a xenon arc lamp is favorable since it supplies a fairly constant, intensive radiation over the whole visible spectrum. Compared with a halogen tungsten lamp this reduces markedly the necessity to suppress long-wavelength false light. Our combination of a XBO 150 W/l lamp (Osram) driven by a VX 150 power supply (Leitz) yielded a sufficient stability. The requirements of the monochromatizing device for application in microscope photometry are 1) high maximal transmission to provide a sufficient signal-to-noise ratio at the photodetector; 2) narrow transmission band and efficient false (or stray) light supression, because broad transmission bands as well as false light cause the absorbing system to show irregular multicomponent properties that lead to nonlinear concentration-OD relationships even for solutions; and 3) compatibility with the microscope optics. To meet these demands we chose a narrow-band interference filter (hmax 447.7 nm, 7ME1x 0.45, HW 3.7 nm; type MA 3-0.3; Schott, Mainz, West Germany). With an additional long-wavelength block filter (BG 12, 3mm; Schott) we achieved a total false light attenuation greater than 2 x 10⁶. For this filter deduction 4). Inasmuch MICROPHOTOMETRIC DETERMINATION OF HEMATOCRIT combination we proved independence of the measured OD values from oxygen saturation in the range from 5 to 95% HbO, both for hemolysates and RBC suspensions. Aperture angles. As stated above, it is advantageous for the purpose of hematocrit determination to reduce the scattering component of OD,,, as much as possible. This can be done not only by adjusting the measuring wavelength but also by optimizing the aperture angles of the incident and accepted light beams.-With increasing acceptance angle (y) the amount of scattered light flux detected by the photosensor is increased. It is obvious from Fig. 1A as well as from Eq. 2 that OD,,, is thereby reduced. This phenomenon is demonstrated for the whole hematocrit range in Fig. 3, which combines the macroscale photometer data of Fig. 2 with the microscope measurements made in a 35pm diameter glass tube. The acceptance angle for the microscopic measurements was varied by using objectives of different numerical apertures (na) while the aperture angle of the incident light cone (CU)was adjusted with the aperture diaphragm of the substage condenser. The difference between the individual OD,,, curves and the calculated OD,b, line indicates the loss of light due to scattering and decreases drastically with increasing y. As a similar effect is obtained on reduction of cy,it is necessary to minimize the condenser aperture (25, 27) and combine it with a highna objective, in contrast to the procedures of Jendrucko and Lee (12) and Lipowsky et al. (20), who matched the apertures of condenser and objective. In the succeeding A=448 nm experiments we therefore used a water-immersion objective (25 W, na 0.6; Leitz) yielding a y of 23” and a longworking-distance condenser (L 20, na 0.45; Leitz) adjusted to an aperture angle cyof 4" (na 0.1). GZare. A special feature of microscope photometry is that, in contrast to large-scale, parallel-beam photometry, only a part of the incident light cone is attenuated by the specimen and supposed to be transmitted to the photometric field. However, due to reflections at the multiple surfaces and lens mounts in the illuminating and imaging system, the measuring field will be illuminated with light that has not been attenuated by the specimen under investigation (Schwarzschild-Villiger effect; 24, 25, 34). The intensity of this unwanted light is called “glare” (G), and its influence on OD measurement is mathematically given as (7) or (8) where lo and I are the incident and transmitted light intensities. The asterisks indicate values that are erroneous due to glare. Since G is a constant for a given set of operating conditions the difference between OD and OD* increases with OD. Because some of the measures usually taken to reduce the rise of glare (25) are not applicable here (e.g., the reduction of the illuminated area), it is especially necessary to use an empirical correction procedure. Glare values can be measured directly for a given set of conditions as the light intensity of the image of a totally opaque specimen that resembles the object to be studied. In our in vitro experiments we perfused the glass tubes with a highly concentrated dye solution (congo red) to render them nontransparent within the limits of intensity resolution. Because it was not possible to fill living vessels with this dye, we placed thin metal wires (diam ranging from 14 to 75 pm) on the rat mesentery for the in vivo determination of G. A correcting factor independent of the absolute intensity of the incident light (lo) was then defined as Hctr 3. Influence of photometric and OD,,l. Also shown is calculated data are given in table. aperture on relation OD,b, curve (broken FIG. Magnification na Microscope 0 cl V A Large-scale X X0 (ho 23 23 13 9 8 21 11 8 1 1 photometer 0.60 0.60 0.35 0.25 x25 x25 x25 x10 I$ I; - G (9) F was determined Objective Symbol F -- between HctT Line). Original photometer in vitro and in vivo; the results are given in Fig. 4. There is no systematic difference between the in vivo and in vitro values if all optical parameters including cleanliness of the surfaces are held constant so that the additional glare arising from the mesenteric tissue seems to be negligible. This may not be true for other tissues used in vital microscopy. With the use of &. 9, Eq. 8 can be rewritten as OD = logI Gi FU * - I$ + G/F) (10) H172 PRIES, 10 was employed for all calculations of OD values from microscope photometer measurements. Photosensing system. The ideal photosensing system for the present purpose should fulfill three major requirements, i.e., 1) sufficient absolute and relative sensitivity in the employed spectral range; 2) high intensity resolution and signal-to-noise ratio; and 3) suitability for in vivo application. As fairly monochromatic light of high intensity was used, the first demand is accomplished by a variety of devices such as photomultipliers, phototransistors, blue-enhanced photoelements (29)) or vidicon tubes. Between the second and the third requirement compromising is necessary. The common photosensors (photomultiplier, photoelement, phototransistor) provide high resolution and signal-to-noise ratio for a single measuring spot. The video system, on the other hand, makes it possible to analyze off-line the simultaneous values of OD in any number of vessels present in a field of view. We therefore decided to use a closed-circuit TV sysEquation 1107 I F = 0.274 I D-o*657+ ’ I F 1.0s %b . 0----h.I loo! 20 0 I 1 60 I 80 FIG. 4. Glare correction factor (F), determined for the microscope photometer equipment, as a function of tube diameter (ID). Shown are in vivo values (I, determined with glass tubes filled with congo red dye) and in vitro values (0, determined with metal wires placed on the mesentery) with SD (bars). Also given is the least-square power regression function fitted to both in vivo and in vitro data. q A AND GAEHTGENS tern, consisting of a RCA 1005 camera equipped with an ultricon tube and an IPM 202 video analyzer (IPM, San Diego, CA), which provides a signal-to-noise ratio of approximately 200:1, allowing measurements up to an optical density of 2.2. This upper limit is acceptable because the measurement of higher ODs is restricted due to the increasing error caused by glare, false light, and so on. In spite of the fact that the automatic gain control was disabled, the camera showed some overall sensitivity reactions upon changes in image contrast and light intensity. Therefore it was not possible to perform the zero adjustment by simply shutting off the light beam. In contrast, it was necessary to introduce a black area into the image that could be used as a permanent zero reference. To eliminate simultaneously the influence of other illumination and sensitivity inhomogeneities in time (fading) and space (shading) a grid of 6 X 6 small black dots painted on a cover glass was placed into the light beam at the level of the primary image. With the use of one of these totally opaque dots in the immediate neighborhood of the measuring field as zero reference, both zero and sensitivity (100% transmittance) adjustment could be renewed with every measurement and at any spot within the field of view. In the in vitro experiments the bright level reference for the sensitivity adjustment was obtained by perfusing the glass tubes with KrebsRinger solution. For in vivo measurements a “homogenous” tissue area adjacent to the vessel under observation has to be employed for this purpose. The overall performance of the microscope photometer system consisting of light source, monochromatizing filters, microscope optics, vidicon tube, video camera, and analyzer is demonstrated in Fig. 5 in which the OD,,l is given as function of hemoglobin concentration (c) for five glass tubes with inner diameters between 13 and 68 pm. The data show fair agreement with the theoretical 68pm 47pm KANZOW, cl / 20. OD sol 1.c FIG. 5. Optical density of hemoglobin solutions (OD,,J as a function of the hemoglobin concentration (c) for 5 tube diameters and X = 448 nm. Lines shown beside original data are calculated from ID, c, and c using Lambert-Beer equation. Average percent deviation of measurements from the theoretical curves is -3.3 t 12.4%. MICROPHOTOMETRIC DETERMINATION OF H173 HEMATOCRIT values calculated from ID, hemoglobin concentration, and the 6 value taken from the literature (3), using the Lambert-Beer equation. The requirements as to linearity and validity of the measuring system seem to be fulfilled, keeping in mind that some systematic deviation of the experimental data is introduced by errors in determination of tube diameter and hemoglobin concentration. atocrit range. This is due to the above-mentioned methodical measures that are aimed at reducing the relative magnitude of OD,,, compared with OD,b,. For the experiment shown in Fig. 6A the OD,,, values are given in Fig. 7. They were obtained as the difference between the measured optical density of the suspension and the OD,b, values calculated from Eq. 5. According to Twersky’s formalism (Eq. Z), the scattering function should have a parabolic shape with a maximum at Hctr = 0.5 and should exhibit zero values at Hctr = 0 and HctT = 1. The data shown in Fig. 7 show reasonable agreement with these requirements although the maximum of OD,,, appears to be shifted to Hctr values below 0.5. Since changes in RBC conformation and orientation will mainly influence the scattering properties of the suspension, the reduction of the scattering component of OD achieved in the present method may explain the fact RESULTS The results of two separate calibration experiments with red cell suspensions are shown in Fig. 6. RBC suspensions and capillary assemblies were independently prepared for both experiments. In contrast to the results of Jendrucko and Lee (12) and Lipowsky et al. (20), there is a significant, single-valued correlation between Hctr and OD for all capillary diameters over the entire hem1 1 1 1 L I L 1 1 4 o A 0 o v 68 pm 47 pm 34 w 26 pm 13pm OD sus 1.0 Hct T OD sus Hct T FIG. 6. Results of 2 separate calibration experiments at X = 448 nm. OD,,, values vs. HctT are shown for 5 tubes of different diameters. H174 PRIES, KANZOW, AND GAEHTGENS 04. - 03. 0 68 pm A 47pm 0 o 34 pm 26 pm v 13um 02. FIG. 7. OD, values for the data of Fig. 6A as a function of HctT. OD,, was calculated as difference between OD,,, OD,b, was obtained and ODabs, where from Eq. 5. OD sea 01. 0 I I 0’2. 014 . Hct T 1 I I 06 l that we found no detectable variations of OD,, values with changes in flow velocity. Only at extremely low perfusion rates (center-line velocity below 0.1 mm/s) or for stopped flow did the measurements become erratic. For a convenient application of these data to in vivo measurements it is desirable to express OD as a singlevalued function,of HctT and ID for the entire calibrated range. This was achieved by using a “unifying term” (E) of the general form E = (ID + A) (D(HctT + K) + [(Hct* (11) -I- K) - (HctT + K)2]) where the parameters A, D, and K were optimized separately to analyze both data sets of Fig. 6, and ID is given in pm. The constant D is of interest insofar as it determines the linear component of the relation between hematocrit and optical density, whereas the term (HctT + K) - (Hctr + K)2 delineates the parabolic dependence of OD,,, on HctT according to Twersky’s theory (Eq. 2). OD,,, values are plotted as function of the unifying term E in Fig. 8, A and B, for the data of Fig. 6 together with their linear regression fits. A common regression line fitted to all data of both experiments after optimizing the parameters A, D, and K of the unifying term is described by the function OD = (ID + 9) [2 (Hctr - 0.03) - (Hctr - o.03)2] 0.02719 + 0.00134 (12) (r = 0.9956) Solving Eq. 12 for HctT yields Hctr = 1.03 - OD - 0.00134 (ID + 9) 0.02719 (13) . 08. . * I I I to The tube hematocrit HctT can be obtained from this equation for each pair of ID and OD values, provided the calibrated range is not exceeded. While ID is measured directly, OD is calculated from measured light intensities using Eqs. 9 and 10. To evaluate the precision of the method the difference between the actual HctT in the capillary tube (derived from HctF) and the HctT value calculated using the above procedure was determined; for this purpose the data set in Fig. 6B and the corresponding parameters of the unifying term given in Fig. 8B were used. A standard deviation of -1-0.02 units of fractional hematocrit was found for this experiment. To test the reproducibility of the method the two calibration experiments underlying Fig. 6, A and B, were compared. If the OD-ID data of the experiment shown in Fig. 6B were fed into the regression function of Fig. 8, A and B, a set of paired HctT values is obtained. The differences between the HctT values in each pair averaged 0.025 t 0.01 units of fractional hematocrit. Relative to the absolute level of HctT, this corresponds to an error of 7.5 t 3% within the calibrated HctT range. It is concluded that this represents a significant improvement in comparison to an rms error of t26.2% reported by others (20). This improvement appears essential in view of additional errors that might occur if the method is applied in vivo. If, for instance, a measurement is performed in a 40 pm-vessel with a hematocrit of 0.26, an error in the measurement of ID of 5% (2 pm) and an error in the determination of OD of 10% will in the worst case lead to a hematocrit deviation of 14.5% of the correct value. Recently two methods have been described that yield comparably precise hematocrit measurements. For the differential wavelength method . (21) an rms error of 11.6% is reported for hematocrit determina .tions in tubes MICROPHOTOMETRIC DETERMINATION l 4 _ IAl A‘ L OF I H175 HEMATOCRIT 1 L I r opm 1 2.0 2.0- ocl 68Crm 68um A A47pm 47pm 00 34 pm o 26 pm pm v 13pm / 0 2’cl I U0 00 sus 00 1 / A / / IO- A /@ PO A 86 & 9 ,dG ,&-A A OD = E x O.O34l+ II 20 II I 40 0.0165 II 44 11 60 E L I ‘ . 1 I o 68pm 2.0I- 0' A4?pm 0 34 FIG. 8. OD,,, data of Fig. 6, A and B, vs. “unifying term” E. A: E = (ID + 7) to.75 (HctT - 0.03) + [ (Hcb - 0.03) (Hcb - 0.03)2]) (r = 0.9976). B: E = (ID + 10) il.3 (HctT - 0.03) + [(Hctr - 0.03) - (HctT - 0.03)2] 1 (r = 0.9984). Also shown are the least-square regression fits for both experiments. pm o 26pm v 13pm OD sus 1.0 I- 1 OD- O- F 0 , I 30 I I 60 E x0.021650.00234 I I 90 E from 40 to 70 pm ID. While the two-wavelength method requires a simpler calibration procedure, the in vivo applicability of the present technique to a larger range of vessel diameters and the possibility of simultaneous measurements in several vessels (from the video tape recordings) should be emphasized. The applicability of the original red cell counting technique has been significantly increased by using fluorescently labeled erythrocytes (32, 42) as tracers. For this method the standard deviation of the calculated hematocrit was determined to be 17% (32). The counting procedure needs no in vitro calibration and is mostly independent of the optical properties of the tissue under investigation. On the other hand, it depends absolutely on normal rheological behavior of the labeled cells and a precise estimate of the systemic tracer cell concentration. Also the sampling period required for counting a sufficient number of labeled cells makes it impossible to detect fast changes of microvessel hematocrit. DISCUSSION The purpose of the present study was to search for a method capable of determining hematocrit values in single microvessels as well as the hematocrit distribution within a microvessel network. Direct counting of RBC by means of a photoelectric device or by analysis of microphotographs is trustworthy H176 PRIES, KANZOW, only under single-file flow conditions (10) and is thereby restricted to very small vessels or low hematocrits. It was recently suggested that systematically administered fluorescent red blood cells could be used as tracers (32, 42) to extend the range of vessel diameters and hematocrits that can be analyzed. The approach of this study is based on the microphotometric determination of the optical density over a certain vessel that then is related to the HctT (12). Because the necessary calibration procedure presented here was performed in artificial tubes a systematic error might occur when the results are applied to in vivo measurements. Since it was shown that the absorption part of OD was measured correctly in the calibrating experiments, this uncertainty is restricted to the scattering component of OD,,,, whose relative magnitude was reduced by the methodical measures described. The red cell labeling technique (32, 42) might provide the possibility of an in vivo recalibration of the microphotometric hematocrit measuring method. As the precision and reliability of the microphotometric approach has been favorably increased, it is now possible to profit by its advantages, which include no interference with the flow AND GAEHTGENS within the microvessels, no systemic administration of tracer material, continuous HctT determination at a sampling rate limited by the video system used, and off-line analysis of simultaneous and sequential HctT values in any number of vessels present in a field of view. In designing a system based on the photometric approach described here but with different components, the following guidelines should be followed. 1) The incident light should have a narrow wavelength band and very efficient long wavelength suppression. 2) A low-na condenser should be combined with a high-na objective. 3) The response of the TV camera to changes in overall light intensity must be recognized and corrected for. Most TV cameras will show such reaction even if they have no automatic gain control or such control has been disabled. 4) Appropriate correction must be made for glare. The authors thank Dr. Giles Cokelet for his efforts in discussing and improving the manuscript. This work was supported by a grant from the Deutsche Forschungsgemeinschaft. Preliminary material has been published (B&Z. Anut. 20: 24-27, 1981). Received 1 June 1982; accepted in final form 7 February 1983. REFERENCES 1. ANDERSON, N. M., AND P. SEKELJ. Light-absorbing and scattering properties of nonhemolysed blood. Phys. Med. Biol. 12: 173-184, 1967. 2. ANDERSON, N. M., AND P. SEKELJ. Reflection and transmission of light by thin films of nonhaemolysed blood. Phys. Med. BioL. 12: 18%192,1967. 3. ASSENDELFT, 0. W. VAN. Spectrophotometry of Hemoglobin deriuates. Assen, The Netherlands: Van Gorcum, Thomas, 1970. 4. BARBEE, J. H., AND G. R. COKELET. The Fahraeus effect. Microuusc. Res. 3: 6-16, 1971. 5. BARER, R. Spectrophotometry of clarified cell suspensions. Science 121: 709-715,1955. G., AND G. C. C. HSIAO. Phase separation in 6. BUGLIARELLO, suspensions flowing through bifurcations: a simplified hemodynamic model. Science 143: 469-471, 1964. 7. COHNSTEIN, J., AND N. ZUNTZ. Untersuchungen uber den Flussigkeitsaustausch zwischen Blut und Geweben unter verschiedenen physiologischen und pathologischen Bedingungen. Pfluegers Arch. 42: 303-341, 1888. 8. DUYSENS, L. N. M. The flattening of the absorption spectrum of suspensions, as compared to that of solutions. Biochim. Biophys. Acta 19: 1-12, 1956. P., K. H. ALBRECHT, 9. GAEHTGENS, AND F. KREUTZ. Fahrraeus effect and cell screening during tube flow of human blood. Bio- rheology 15: 147-154,1978. P., C. D~HRSSEN, 10. GAEHTGENS, AND K. H. ALBRECHT. Motion, deformation, and interaction of blood cells and plasma during flow through narrow capillary tubes. Blood Cells 6: 799-812,198O. B. L. The absorptive spectra of hemoglobin and its 11. HORECKER, derivatives in the visible and near infra-red regions. J. BioZ. Chem. 148: 173-183, 12. JENDRUCKO, red cell flow in resting and contracting striated muscle. Am. J. Physiol. 23 (Heart Circ. Physiol. 6): H481-H490, 1979. 17. KROGH, A. Studies on the physiology of capillaries. II. J. Physiol. London 55: 412-422,192l. P., AND C. A. H. EUBANKS. 18. LATIMER, Absorption spectrophotometry of turbid suspensions: a method of correcting for large systematic distortions. Arch. Biochem. Biophys. 98: 274-285, 1962. 19. LIPOWSKY, H. H., S. USAMI, AND S. CHIEN. In vivo measurements of “apparent viscosity” and microvessel hematocrit in the mesentery of the cat. Microuusc. Res. 19: 297-319, 1980. 20. LIPOWSKY, H. H., S. USAMI, S. CHIEN, AND R. N. PITTMAN. Hematocrit determination in small bore tubes from optical density measurements under white light illumination. Microuasc. Res. 20: 51-70,198O. 21. LIPOWSKY, H. H., S. USAMI, S. CHIEN, AND R. N. PITTMAN. Hematocrit determination in small bore tubes by differential spectrophotometry. Microuusc. Res. 24: 42-55, 1982. 22. LOEWINGER, E., A. GORDON, A. WEINREB, AND J. GROSS. Analysis of a micromethod for transmission oximetry of whole blood. J. Appl. Physiol. 19: 1179-1184, 1964. G. F., AND P. C. LEWIS. 23. LOTHIAN, Spectrophotometry of granulated materials, with particular reference to blood corpuscles. Nuture London 178: 1342-1343,1956. 24. NAORA, H. Schwarzschild-Villiger-effect in microspectrophotometry. Science 115: 248-249, 1952. 25. PILLER, H. Microscope Photometry. Berlin: Springer, 1977. 26. PITTMAN, R. N., AND B. R. DULING. A new method for the measurement of percent oxyhemoglobin. J. Appl. Physiol. 38: 315320,1975. 27. PITTMAN, R. N., AND B. R. DULING. Measurement of percent oxyhemoglobin in the microvascularture. J. Appl. Physiol. 38: 321- 1943. R. J., AND J. S. LEE. The measurement of hematocrit of blood flowing in glass capillaries by microphotometry. Microuusc. Res. 6: 316-331, 1973. P. C., J. BLASCHKE, 13. JOHNSON, K. S. BURTON, AND J. H. DIAL. Influence of flow variations on capillary hematocrit in mesentery. 327,1975. 28. PRIES, A. R., K. H. ALBRECHT, 29. Am. J. Physiol. 221: 105-112, 1971. G., A. R. PRIES, AND P. GAEHTGENS. 14. KANZOW, hematocrit distribution Microcirc. 15. KEILIN, Analysis of the in the mesenteric microcirculation. Int. J. Clin. Exp. 1: 67-79, 1982. D., AND E. F. HARTREE. Spectrophotometric studies of Biophys. Acta 27: suspensions of pigmented particles. Biochim. 173-184,1958. B., AND B. R. DULING. Microvascular hematocrit and 16. KLITZMAN, 30. 31. 32. AND P. GAEHTGENS. Model studies on phase separation at a capillary orifice. Biorheology 18: 355-367, 1981. PRIES, A. R., G. KANZOW, AND P. GAEHTGENS. Improvement and calibration of a method for determination of microvessel hematocrit. Bibl. Anut. 20: 24-27, 1981. E. I. Photosynthesis II. New York: Interscience, RABINOWITCH, 1956, p. 709. RUBINSTEIN, D. L., AND H. M. RAVIKOVICH. Absorption spectrum of hemoglobin in red cells. Nature London 158: 952-953, 1946. SARELIUS, I., AND B. R. DULING. Direct measurement of microvessel hematocrit. red cell flux. velocitv, and transit time. Am. J. MICROPHOTOMETRIC Physiol. 243 (Heart 33. SCHMID-SCH~NBEIN, DETERMINATION H177 OF HEMATOCRIT Circ. Physiol. 12): HlOl&-H1026, G. W., AND B. W. ZWEIFACH. 1982. RBC velocity profiles in arterioles and venules of the rabbit omentum. Microuasc. Res. 10: 153-164, 34. SCHWARZSCHILD, 1975. K., AND W. VILLIGER. On the distribution brightness of the ultra-violet light on the sun’s disk. Astrophys. of J. 23: 284-305,1906. 35. SHIBATA, K., A. A. BENSON, AND M. CALVIN. The absorption spectra of suspensions of living micro-organisms. Biochim. Biophys. Actu 15: 461-470, 1954. 36. SVANES, K., AND B. W. ZWEIFACH. Variations in small vessel hematocrit produced in hypothermic rats by micro-occlusion. Mi- crouasc. Res. 1: 210-220, 1968. 37. TWERSKY, V. Multiple scattering of waves and optical phenomena. J. Opt. Sot. Am. 52: 145-171,1962. 38. TWERSKY, V. Interface effects in multiple scattering by large, lowrefracting, absorbing particles. J. Opt. Sot. Am. 60: 908-914, 1970. 39. TWERSKY, V. Absorption and multiple scattering by biological suspensions. J. Opt. Sot. Am. 60: 1084-1093,197O. 40. WEVER, R. Untersuchungen zur Extinktion von stromendem Blut. Pfluegers Arch. 259: 97-109, 1954. 41. YEN, T. T., AND Y. C. FUNG. Effect of velocity distribution on red cell distribution in capillary blood vessels. Am. J. Physiol. 235 (Heart Circ. Physiol. 4): H251-H257, 1978. 42. ZIMMERHACKEL, B., M. STEINHAUSEN, AND N. PAREKH. Varia- tions in single glomerular loop flow by angiotensin measured with fluorescent erythrocytes (Abstract). Pfleugers Arch. 391, Suppl.: R19,1981.
