APPLICATION NOTE
Transmission Sampling Techniques – Theory and Applications
FTIR sampling by transmission is a very popular method for
collection of infrared spectra. Its use is easy to explain – the
methods are intuitive and do not require sophisticated sampling
accessories. In many cases, the sample can be placed directly into
the path of the infrared beam (with the help of sample holder) and
scanned. Further benefits of transmission sampling techniques
include compatibility with automated sampling and microsampling
techniques such as IR Microscopy.
Transmission techniques are well documented and have been
successfully used for many years. A large number of spectral
libraries contain transmission spectra and are often used as
references for the purpose of qualitative analysis. Transmission
techniques offer many advantages and should be used whenever
possible, unless reliable sample preparation becomes too difficult,
too time consuming or impossible. Transmission is also widely
used for quantitative applications, as significant numbers of basic
measurements adhere to the Beer-Lambert law. The law provides
a mathematical relationship between the infrared radiation
absorbed by the sample and the sample concentration:
Sample Preparation and Analysis
A=a•b•c
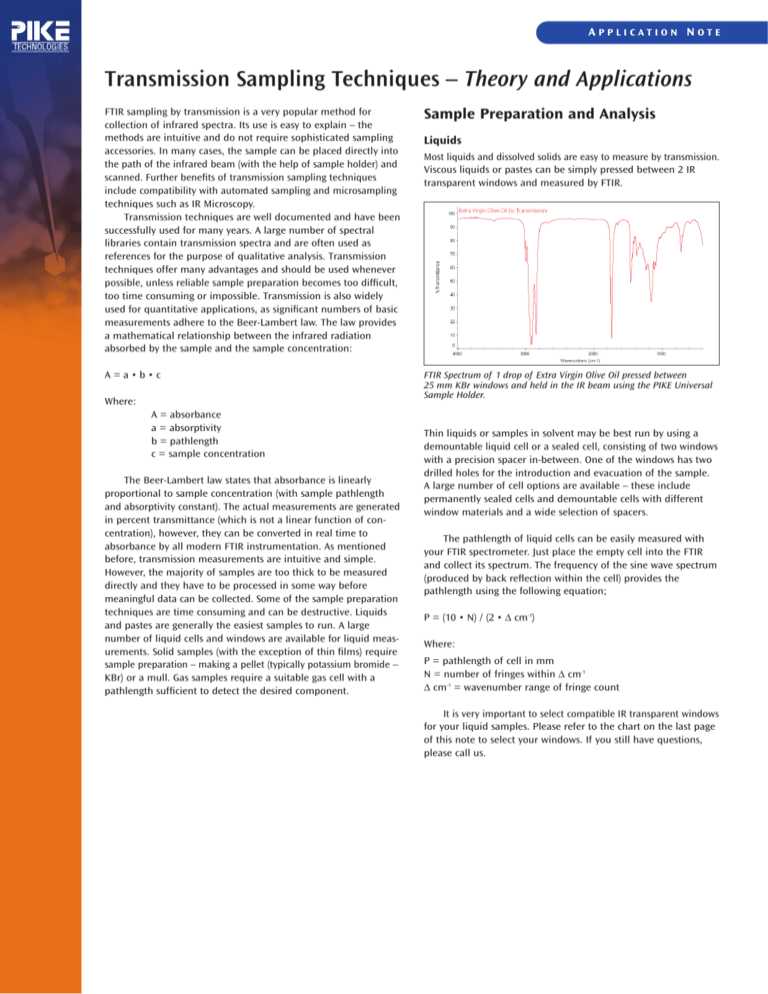
FTIR Spectrum of 1 drop of Extra Virgin Olive Oil pressed between
25 mm KBr windows and held in the IR beam using the PIKE Universal
Sample Holder.
Where:
A = absorbance
a = absorptivity
b = pathlength
c = sample concentration
The Beer-Lambert law states that absorbance is linearly
proportional to sample concentration (with sample pathlength
and absorptivity constant). The actual measurements are generated
in percent transmittance (which is not a linear function of concentration), however, they can be converted in real time to
absorbance by all modern FTIR instrumentation. As mentioned
before, transmission measurements are intuitive and simple.
However, the majority of samples are too thick to be measured
directly and they have to be processed in some way before
meaningful data can be collected. Some of the sample preparation
techniques are time consuming and can be destructive. Liquids
and pastes are generally the easiest samples to run. A large
number of liquid cells and windows are available for liquid measurements. Solid samples (with the exception of thin films) require
sample preparation – making a pellet (typically potassium bromide –
KBr) or a mull. Gas samples require a suitable gas cell with a
pathlength sufficient to detect the desired component.
Liquids
Most liquids and dissolved solids are easy to measure by transmission.
Viscous liquids or pastes can be simply pressed between 2 IR
transparent windows and measured by FTIR.
Thin liquids or samples in solvent may be best run by using a
demountable liquid cell or a sealed cell, consisting of two windows
with a precision spacer in-between. One of the windows has two
drilled holes for the introduction and evacuation of the sample.
A large number of cell options are available – these include
permanently sealed cells and demountable cells with different
window materials and a wide selection of spacers.
The pathlength of liquid cells can be easily measured with
your FTIR spectrometer. Just place the empty cell into the FTIR
and collect its spectrum. The frequency of the sine wave spectrum
(produced by back reflection within the cell) provides the
pathlength using the following equation;
P = (10 • N) / (2 • Δ cm-1)
Where:
P = pathlength of cell in mm
N = number of fringes within Δ cm-1
Δ cm-1 = wavenumber range of fringe count
It is very important to select compatible IR transparent windows
for your liquid samples. Please refer to the chart on the last page
of this note to select your windows. If you still have questions,
please call us.
Solids
The easiest to analyze are film and polymer samples less than
200 micrometers thick (ideal thickness for the major component
of a polymer film is about 20 microns). These samples can be
simply placed into a sample holder and immediately scanned.
However, the majority of solid materials must be prepared
before their infrared spectra can be collected. In many cases
sample preparation involves grinding of the sample and mixing it
with an IR transparent material such as KBr and then pressing a
pellet. While this method of solids analysis is time consuming, it
produces an excellent result.
Polymer Film from Product Packaging Material – held in place with
the PIKE Universal Sample Holder. Polymer is identified as Atactic
Polypropylene and the film is determined to be 27.1 microns thick.
FTIR Spectrum of Caffeine prepared as a 13 mm KBr Pellet and held in
position with the PIKE Sampling Card.
The thickness of the polymer film can be calculated from the
fringe pattern in the spectrum using the following equation;
T = (10000 • N) / (2 • n • Δ cm-1)
Where:
T = thickness of polymer film in microns
N = number of fringes within Δ cm-1
Δ cm-1 = wavenumber range of fringe count
n = refractive index of polymer
The same procedure can be used for samples which can be
sliced and pressed to an appropriate thickness – especially for IR
microsampling.
For IR microsampling, one can place a small sliced sample
into a sample compression cell and apply pressure to hold the
sample and to thin it to a useable thickness – as shown in the
following spectral data.
Solid Sample Preparation Tips
The best method for preparation of solid samples involves mixing
the sample (about 5% by weight) with an IR transparent material
(typically KBr) and pressing a pellet. The mixing is best done with
the ShakIR accessory which produces a fully mixed and pulverized
sample in about 30 seconds. The mixing can also be done with a
mortar and pestle – but not as well. Generation of a pellet involves
pressing the prepared mixture with a hydraulic or hand press into
a hard disk. The pellet, ideally 0.5 to 1 mm thick is then placed in
a transmission holder and scanned. Typically, the pellet technique
provides good quality spectra with a wide spectral range and no
interfering absorbance bands.
Samples which do not grind well and/or are affected by
solvents and mulling agents can be analyzed with high pressure
techniques. Typical samples include fibers and paint chips. The
accessory used for such applications utilizes two diamond anvils.
Difficult samples are placed between the diamonds and crushed,
compressed and flattened to the thickness necessary to obtain
good quality FTIR spectra. Diamond cells are transparent to IR
radiation except in the region of 2400 cm-1 to 1700 cm-1. The high
pressure diamond cells require the use of a beam condenser or
an infrared microscope.
Micro Spectrum of a Layered Polymer using a PIKE µMAX IR Microscope
and Compression Cell with KBr windows.
FTIR Spectrum of Methanol Vapor measured with the PIKE 100 mm gas
cell using 0.50 cm-1 spectral resolution.
An alternate method for analysis of solid materials involves
making a mull. Mulls are sample suspensions in Nujol (refined
mineral oil) or Fluorolube (perfluorohydrocarbon). The process
is based upon mixing 1 to 2 drops of the mulling agent with a
ground sample until a uniform paste is formed. The paste is
transferred onto a KBr or other IR transparent disk, placed in
the sample compartment of the spectrometer and scanned. The
advantage of this technique is that it is a relatively quick and
simple procedure; disadvantages include interference from
mulling agent absorption bands. (Both Nujol and Fluorolube have
characteristic spectral features and in most cases have to be used
as a pair in order to generate a complete mid IR spectrum. Nujol
is used below 1330 cm-1, Fluorolube above 1330 cm-1).
Simple demountable cells (50 mm to 100 mm) are recommended for samples in a 1 – 10% by weight concentration range.
For highly dilute samples (ppm to ppb concentrations), longpath cells are required. The long-path cell reflects the IR beam
several times through the sample using a set of mirrors positioned
on the opposite ends of the cell, producing a pathlength to 10 to
30 meters – or more. It is important to select window materials
compatible with the investigated sample. Gas sampling accessories
can be fitted with different windows to accommodate the physical
and chemical characteristics of the measured gas. Special designs
for high pressure and temperature controlled experiments are
also available.
Gases
Transmission sampling by FTIR provides an excellent means for
sample identification and quantification of sample components.
Most samples measured by transmission techniques require
some sample preparation, however, the quality of the results
and amenability to automation and microsampling offer
significant advantages.
Summary
Analysis of gas samples is a unique form of transmission sampling
by FTIR as the identified sample does not need to be of pure
composition. At high spectral resolution, most gas mixtures can
be identified and quantified since absorbance bands can be
selected within the spectrum, which are resolved and distinct
from other components within the sample.
Properties of Select Infrared Transmitting Materials For Transmission Spectroscopy
SWL cm-1
LWL cm-1
RI
Solubility g/100 g
Hardness kg/mm2
MP °C
pH Range
11000
593
2.50
0.00
170
370
1–9
Material
Comments
AMTIR
GeAsSe glass, brittle
BaF2
Barium Fluoride
66600
691
1.45
0.17
82
1280
5–8
CaF2
Calcium Fluoride
79500
896
1.40
0.0017
158
1360
5–8
CsI
Cesium Iodide, very hygroscopic,
Somewhat Toxic
42000
172
1.73
44
20
621
NA
Diamond
Type IIa, strong IR absorbance
between 2700-1800 cm-1, costly
30000
<2
2.40
0.00
5700
550
flash point
1 – 14
Ge
Germanium, brittle, becomes
opaque at elevated temperatures
5500
432
4.00
0.00
780
936
1 – 14
KBr
Potassium Bromide, most widely
used for mid-IR applications
48800
345
1.52
53
6
730
NA
KRS-5
Thallium Bromide/Thallium
Iodide, Extremely Toxic!
17900
204
2.37
0.05
40
414
5–8
NaCl
Sodium Chloride
52600
457
1.49
36
18
801
NA
Polyethylene
For Far-IR, swells with
some organic solvents
625
<4
1.52
0.00
110
1.5 – 14
SiO2
Silicon Dioxide
50000
2315
1.53
0.00
460
1713
1 – 14
Si
Silicon, strong IR absorbance
between 624-590 cm-1
8900
624, 30
3.41
0.00
1150
1420
1 – 12
ZnS
Zinc Sulfide
17000
690
2.20
0.00
240
1830
5–9
ZnSe
Zinc Selenide
15000
461
2.40
0.00
120
1526
5–9
Notes: The above table is meant to be a general guide – brief and concise. For more information about these materials, consult appropriate reference books and
Material Safety Data Sheets (MSDS).
SWL – Shortest wavelength for transmission, 1 mm, 50% transmission
LWL – Longest wavelength for transmission, 1 mm, 50% transmission
RI – Refractive Index, at relevant wavelength
MP – Melting point
6125 Cottonwood Drive Madison, WI 53719 • (608) 274-2721 • (608) 274-0103 (FAX) • www.piketech.com • sales@piketech.com (E-MAIL)
©2011 PIKE Technologies. All rights reserved. All trademarks are the property of PIKE Technologies.

