Universal Journal of Accounting and Finance 1(2): 42-50, 2013
DOI: 10.13189/ujaf.2013.010202
http://www.hrpub.org
Stock Market Performance under Different Government
Periods: Evidence from Bangladesh
Md. Afzalur Rahaman1, Md. Bokhtiar Hasan1,*, A. F. M. Mainul Ahsan2
1
Research, Development & Information Department, Dhaka Stock Exchange, 9/F Motijheel, Dhaka, Bangladesh
Department of Economics, School of Business, Independent University, Bangladesh (IUB), Dhaka-1229, Bangladesh
*Corresponding Author: bokhtiar_bank@yahoo.com
2
Copyright © 2013 Horizon Research Publishing All rights reserved.
Abstract While there are many factors that influence
stock market activity, the main focus of this paper is to
examine stock market performance under different political
leadership in Bangladesh. This study mainly considers two
different daily DSE indices’ (DSI and DGEN) return and
some key market indicators for the sample period March 20,
1991 to April 30, 2013. We basically analyzed average
market return, volatility and risk for each government term
(five terms) individually. By means of descriptive
observation and statistical analysis we found evidence that
the performance of stock market was superior under
government term 4 (2006 to 2009) while performance was
worst under government term 2 (1996 to 2001) and term 5
(2009 to 2013). It was also found that the government term 4
was led by nonpolitical party, i.e. Caretaker government
whereas the government terms 2 & 5 were led by the same
political party.
Keywords
Return, Volatility, Democracy, Political,
Dhaka Stock Exchange, Performance
1. Introduction
The people of Bangladesh discovered their identity
through the Language Movement in 1952. The struggle to
establish their identity and national spirit began soon after
1947 when they realized that under Pakistan created on the
two nation theory there was little scope for the distance
culture of Bangladeshis to flourish. Thus Bangladesh
plunged into a civil war. During the nine months struggle
which ensued an estimated three million Bengalis died and
ten million refugees fled into neighboring countries. On
December 16, 1971, the Bangladesh emerged as an
independent and sovereign country in the world. The new
state, the People’s Republic of Bangladesh was founded as a
constitutional,
secular,
democratic,
multi-party,
parliamentary republic. After independence to year 1991,
four general elections were held in 1973, 1979, 1980 and
1988 in Bangladesh (Bijon, 2012). But most of the time
Bangladesh endured political turmoil and military coups.
However, to avoid such type of political turmoil and military
coups, Bangladesh spread no stone unturned. After all these
efforts, a caretaker government was first introduced in 1990.
Since then, the Caretaker government held the elections in
Bangladesh. This can be recognized as the restoration of
democracy in Bangladesh.
It is called that Bangladesh has an endless possibilities to
become a developed country within the shortest period of
time. But, since independence, it continues to face a number
of major challenges, including political and bureaucratic
corruption and political instability. Since 1991, our two main
parties: Bangladesh Nationalist Party (BNP) and Bangladesh
Awami League (AL), come on the power one after another.
But both parties always tried to discontinue the previous
Government policies. In addition, massive anomalies,
corruption and political unrest were seen in all terms of the
Government while the economic development was always
ignored. It is thought that this bad politics always strike our
stock market harshly which resulted several turmoil in 1990,
1996, 2011 and 2012 for instance. Stock market is a very
sensitive market and confidence among investors is the main
thing. Political instability and unrest obviously destroy
confidence among investors on the stock market.
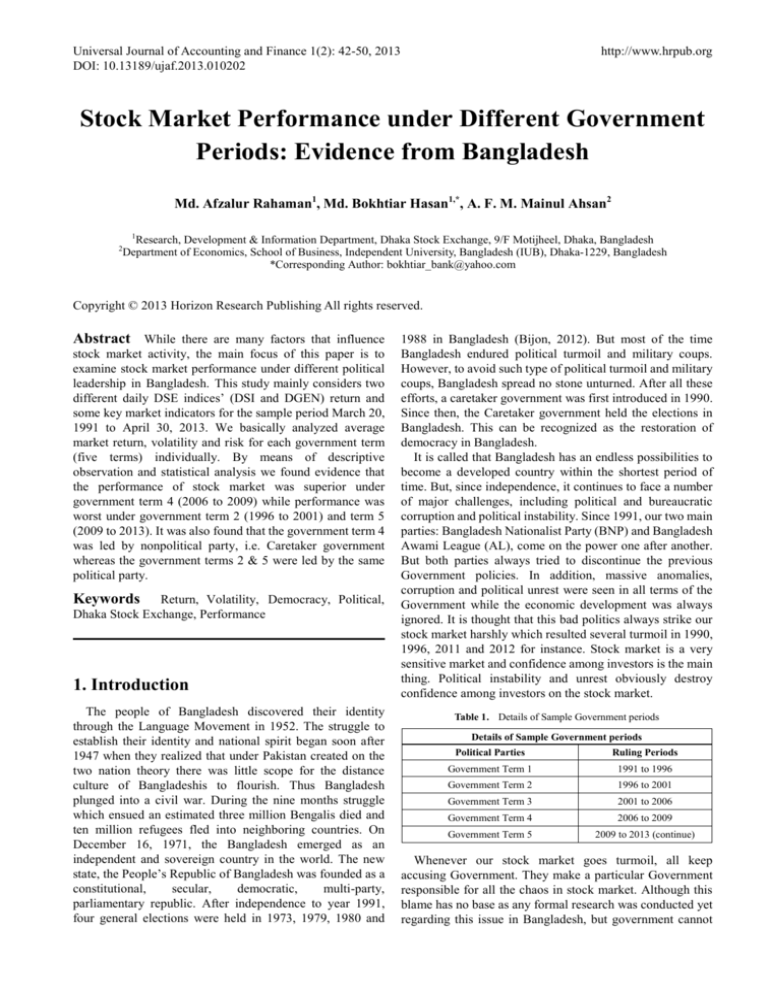
Table 1. Details of Sample Government periods
Details of Sample Government periods
Political Parties
Ruling Periods
Government Term 1
1991 to 1996
Government Term 2
1996 to 2001
Government Term 3
2001 to 2006
Government Term 4
2006 to 2009
Government Term 5
2009 to 2013 (continue)
Whenever our stock market goes turmoil, all keep
accusing Government. They make a particular Government
responsible for all the chaos in stock market. Although this
blame has no base as any formal research was conducted yet
regarding this issue in Bangladesh, but government cannot
Universal Journal of Accounting and Finance 1(2): 42-50, 2013
ignore the liability for any turmoil in the market during their
regime. Hence, we inspired to conduct this study. This study
mainly investigates the performance of stock market under
different Government periods in Bangladesh since 1991 to
2013. Our sample period covers four political Government
terms: 1991 to 1996, 1996 to 2001, 2001 to 2006 and 2009 to
2013, including one nonpolitical Government; Caretaker
(2006 to 2009). Table 1 details the sample Government
periods.
We performed two analyses: descriptive and statistical
analysis. For descriptive analysis we used turnover, market
capitalization, market capitalization to GDP ratio, index, IPO,
turnover ratio, and average daily value traded. For
descriptive statistical analysis: we used market return
(through “DSI” and “DGEN” index). Here, stock market
means Dhaka stock exchange only as it is the main bourse of
Bangladesh. From both the analyses, we found that the
government term 4 (2006 to 2009) was the best for stock
market performance where the market experienced
comparatively less volatility along with highest average
return. On the other hand, the government term 2 (1996 to
2001) and term 5 (2009 to 2013) were the worst for stock
market performance with high volatility against very low or
negative average return and most of the market indicators
showed very low or negative growth.
The rest of the paper is therefore organized as follows.
Part 2 will discuss the literature review regarding this issue.
Part 3 will brief about the Dhaka stock exchange. Part 4 will
focus on Methodology and data. Part 5 will analyze the result
of this research. Part 6 will conclude the study.
2. Literature Review
The performance of the stock market is influenced by a
number of factors, the main ones among them being the
activities of governments and the general performance of the
economy. Extensive studies have been carried out in
America and Britain examining the performance of stock
markets before and after general elections. They have also
examined the performance of the stock markets based on the
party of the President or Prime Minister in Power. These
studies indicate that the stock market react differently based
on the party of the President elected in America while there
was no difference in Britain. On the other hand, we did not
find any research linking different Government terms with
stock market performance in Bangladesh. We, first time, are
going to conduct such study in Bangladesh. Now we will
discuss some major works related to our study.
Relationship between presidency and stock market has
shown very prudently by Ray and Marshall (2012). They
focused on the relationship between U.S. political parties
holding presidential office and S&P 500 performance,
volatility, and risk. The research was encompassed the
specific years within presidential cycle were evaluated for
price change over time and observations were made to
determine if there were any relationships between the
43
political party in office and historical stock market
performance. They described through Descriptive
observations that the average S&P 500 nominal returns
shows 55.03 percent and 23.48 percent for the two different
government period in USA for the period of January 20,
1949 to projected January 20, 2013. To minimize the
argument regarding inflation, they made further adjustments
using the Consumer Price Index chain with a base year of
1980 equal to 100. The results were more modest. They also
found that, while the descriptive observations would suggest
some difference between the political parties holding the
presidency and the performance of the S&P 500, there was
no significant statistical difference between the political
party that holds the government and S&P 500 performance at
the 95 percent level of confidence both in the nominal as well
as in the adjusted composite price levels.
Applying conditional volatility models, Roland and
Michael (2007) analyzed the impact of expected government
partisanship on stock market performance in the 2002
German federal election. Their results showed that
small-firm stock returns were positively (negatively) linked
to the probability of a right- (left-) leaning coalition winning
the election. Moreover, they found that volatility increased
as the electoral prospects of right-leaning parties improved,
while greater electoral uncertainty had a volatility-reducing
effect.
Jedrzej, Katrin and Tomasz (2006) performed an analysis
of 24 stock markets and 173 different governments and
found that there are no statistically significant differences in
returns between left-wing and right-wing executives.
Consequently, international investment strategies based on
the political orientation of countries’ leadership are likely to
be futile.
Oumar and Ashraf (2011) examined the link between
stock returns and the presidential cycle in the United States.
They investigated whether there is a risk-based explanation
for higher returns during Democratic presidencies compared
with Republican presidencies. The findings show that the
market exhibits higher returns when Democrats control the
presidency, with smaller companies experiencing the most
significant improvement.
Santa-Clara and Valkanov (2003) found that there was a
higher excess return in the stock market (using a stock
market index compared to three-month Treasury Bill) when
Democrats were in office. According to their research, which
does not include the last two presidential terms, the excess
returns were 09 percent for the value weighted stock indexes
and 16 percent for the equal weighted portfolio.
Beyer, Jensen, and Johnson (2004) showed that political
gridlock as well as monetary expansion and restrictive fiscal
policies had effects on security performance. They
concluded that the evidence is contrary to popular opinion
that the stock market benefits from political gridlock. After
controlling for shifts in the political landscape, they found
strong evidence that shifts in Fed policy have a significant
relationship with the security returns.
Nikhar (2013) used the surprise, positive jolt that Osama
44
Stock Market Performance under Different Government Periods: Evidence from Bangladesh
Bin Laden’s capture gave to Barack Obama’s 2012
re-election prospects to study the relationship between
business campaign contributions, political connections, and
stock market valuation changes. He found that following Bin
Laden’s death, firms that had previously donated to
Democrats registered significant positive returns whereas
firms that had donated to Republicans registered significant
negative returns. His findings indicate that campaign
contributions serve as financial investments that can yield
major valuation payoffs to firms because investors view
these as signals of political connections.
Ansolabehere, Snyder Jr. and Ueda (2004) found that
these rulings appear to have had no noticeable effect on the
stock prices of firms that were directly affected leading the
authors to conclude that the fundamental critique of
campaign finance in America-that donations come with a
quid pro quo and extract very high returns for donors-is
almost surely wrong.
3. The Dhaka Stock Exchange (DSE): a
Brief Description
In early 1952, five years after the independence of
Pakistan, the Calcutta Stock Exchange prohibited
transactions in Pakistani stocks. This necessitated the
formation of a stock exchange in East Pakistan. Eventually,
on 28 April 1954 the East Pakistan Stock Exchange
Association Ltd. was incorporated. However, formal trading
began in 1956 with 196 securities listed on the DSE with a
total paid up capital of about Taka 4 billion (Chowdhury,
1994). It changed its name to East Pakistan Stock Exchange
Ltd on 23 June 1962 and finally to Dhaka Stock Exchange
(DSE) on 14 May, 1964.
After 1971, the trading activities of the Stock Exchange
remained suspended until 1976 due to the liberation war. The
trading activities resumed in 1976 with only 9 companies
listed having a paid up capital of Taka 137.52 million on the
stock exchange (Chowdhury, 1994).
There are 250 members and total 522 listed securities in
Dhaka Stock Exchange till May 30, 2013. The working days
of DSE is 5 days in a week without Saturday, Sunday public
holidays & other government holidays. The trading time is
from 10:30 am to 2:30 pm (local time). Investment options
for an investor in this market are ordinary share, Debenture,
Bond & Mutual funds.
In the beginning, DSE was a physical stock exchange and
used to trade in the open out-cry system. After that to secure
smooth, timeliness & effective operation on the market, DSE
uses automated trading system. The system was installed on
10th August, 1998 and was upgraded time to time. The latest
up-gradation was web based trading software-MSA Plus
which is introduced on June 10, 2012. Now, investors are
able to submit buy/sale orders on Dhaka stock exchange
from anywhere of the world through Internet.
Before January 28, 2013, DSE had three indices, DSI (All
share), DGEN (A, B, G & N) and DSE 20 where DGEN was
treated as benchmark. None of the DSE indices include
mutual funds, bonds and debentures. However, on January
28, 2013 DSE introduced two new indices which are known
as the DSE Broad Index (DSEX) and DSE 30 Index (DS30)
based on free float and S&P methodology. Now, DSEX is
considered as benchmark index in DSE.
4. Methodology and Data
For our present study we have basically performed two
analyses:
1) Descriptive observations and
2) Descriptive statistical analysis
Applying these two analyses we mainly evaluated the
market return, volatility and risk of the stock market at each
government period individually since 1991. We also
observed whether the political parties holding power in
government had any statistical influence on stock market
performance.
For the descriptive analysis, we used some key indicators
of stock market, i.e. turnover, market capitalization, market
capitalization to GDP ratio, index, IPO, turnover ratio, and
average daily value traded. Here, we observed the growth
pattern of these indicators. Descriptive analysis also includes
graphical presentation where we showed daily index and
turnover.
Here,
Turnover ratio (%) = Total turnover/ Market capitalization
* 100
Average daily value traded = Total turnover / number of
trading days
Market capitalization to GDP ratio = Market capitalization
/ GDP * 100
For descriptive statistical analysis, we used daily index
return as market return (through “DSI” and “DGEN” index).
DSI index includes all stocks where DGEN index includes
all stocks except Z category firms. The daily index return in
period 𝑡𝑡 is calculated using the simple return formula,
Where,
𝑅𝑅𝑡𝑡 =
𝑃𝑃𝑡𝑡 − 𝑃𝑃𝑡𝑡−1
𝑃𝑃𝑡𝑡−1
Pt = Value of security DSI / DGEN Index on day
and
Pt−1 = Value of security DSI / DGEN Index on day prior to
day
Our sample data covers the period from March 20, 1991 to
April 30, 2013. This sample period is also divided into five
different government terms: Term 1 (March 20, 1991 to
March 19, 1996), Term 2 (June 23, 1996 to July 15, 2001),
Term 3 (October 10, 2001 to October 22, 2006), Term 4
(October 31, 2006 to January 05, 2009) and Term 5 (January
05, 2009 to April 30, 2013). The last term of government is
not completed yet.
Universal Journal of Accounting and Finance 1(2): 42-50, 2013
Since, before November 27, 2001 DSE had only one index,
DSE all share Price Index (DSI) and the DSE General Index
(DGEN) was introduced on November 27, 2001, for all
analyses, we used DSI index for the first two government
terms (‘1991 to 1996’ and ‘1996 to 2001’) and used DGEN
for the rest of the three terms (‘2001 to 2006’, ‘2006 to 2009’
and ‘2009 to 2013’). But, before January 01, 1995, daily
turnover is not available, only monthly turnover is available.
Therefore, for the first government term (1991 to 1996),
graphical presentation starts from January 01, 1995.
All data related to stock market are collected from DSE
official website; www.dsebd.org and DSE library. GDP
data are collected from Bangladesh bank official website;
www.bangladesh-bank.org. For all the statistical
computation, we used Microsoft Excel and its data analysis
tool.
5. Data Analysis and Result
This section has two parts. In first part, we just described
the results obtained from both the descriptive and statistical
analyses for each government term separately. The second
part includes major findings where we performed
comparative analysis among different government terms.
Government Term 1 (1991 to 1996)
Descriptive Observations: In table 2; on March 20, 1991
the aggregated value of all trading deals that measures the
efficiency and intensity of assets allocation was Tk. 0.37
million, which stood at Tk. 29.50 million on March 19, 1996
representing 7856 percent growth. The total value of a stock
exchange; Market Capitalization was Tk. 11.90 billion on
March 20, 1991, which reached at Tk. 52.44 billion on
March 19, 1996 registering 341 percent growth. DSE All
Share Index (DSI) was 351.00 points on March 20, 1991
which increased to 830.69 points on March 19, 1996
confirming 137 percent up. The average daily value traded
was Tk. 9.46 million during this period which was Tk. 0.54
million in previous term of the government demonstrates
1657 percent appreciation. Market Capitalization to GDP
ratio was 3.15 on March 19, 1996. At the beginning of the
term, the turnover ratio was 0.003 percent, that increased by
1706 percent to 0.056 percent. During the tenure, a total 67
firms have off-loaded shares in the capital market.
Chart 1 shows the daily DSI index and turnover value. The
highest daily turnover value and DSI Index were Tk. 141.01
million and 903.04 points respectively whereas the lowest
turnover and DSI Index were Tk. 3.62 million and 284.37
points respectively during this term.
Statistical Analysis: In table 7, total 1337 observations
have been used in statistical analysis for this government
term. In statistical findings based on the DSI Index return,
the expected value or average mean return was 0.075 percent.
It is the mean value of returns that investors try to maximize
at each level of risk. The median return was 0.014 percent.
The Standard deviation and coefficient of variation (CV)
were 1.63 percent and 21.59 respectively.
Table 2. Government TERM-1 (1991 to 1996)
Government Term- 1 (1991 to 1996)
Particulars
Turnover Value Tk. in Million
Market Capitalization Tk. in Million
DSE All Share Price Index (DSI) in Points
Initial Public Offerings Nos.
Market cap to GDP ratio in Percentage
Turnover ratio in Percentage
Average Daily Value Traded Tk. Million
Chart 1.
45
March 20, 1991
0.37
11,904.48
351.00
0.88
0.003
0.54
Government Period 1991 to 1996
March 19, 1996 Change in %
29.50
7,855.91
52,442.35
340.53
830.69
136.66
67.00
3.15
258.31
0.056
1,706.00
9.46
1,656.97
46
Stock Market Performance under Different Government Periods: Evidence from Bangladesh
Government Term 2 (1996 to 2001)
Descriptive Observations: In table 3; on June 23, 1996 the turnover value was Tk. 90.65 million, which stood at Tk.
120.10 million on July 15, 2001 representing 32 percent growth. The Market Capitalization was Tk. 66.28 billion on June 23,
1996, which reached at Tk. 70.28 billion on July 15, 2001, registering 6 percent growth. DSI Index was 976.20 points on June
23, 1996, which decreased to 707.77 points on July 15, 2001 witness 28 percent down. The average daily value traded was Tk.
132.44 million during this period which was Tk. 9.46 million in previous government term demonstrates 1300 percent
appreciation. Market Capitalization to GDP decreased from 3.99 percent to 2.57 percent during the tenure. At the beginning
of the term, the turnover ratio was 0.14 percent, that increased by 25 percent to 0.17 percent. During the tenure, a total 61
firms have off-loaded shares in the capital market.
Table 3. Government Term-2 (1996 to 2001)
Government Term- 2 (1996 to 2001)
Particulars
Turnover Value Tk. in Million
Market Capitalization Tk. in Million
DSE All Share Price Index (DSI) in Points
Initial Public Offerings Nos.
Market cap to GDP ratio in Percentage
Turnover ratio in Percentage
Average Daily Value Traded Tk. Million
June 23, 1996
90.65
66,283.82
976.20
Chart 2.
Government Period 1996 to 2001
3.99
0.137
9.46
July 15, 2001
Change in %
120.10
32.49
70,282.93
6.03
707.77
(27.50)
61.00
2.57
(35.59)
0.171
24.95
132.44
1,300.00
Table 4. Government Term-3 (2001 to 2006)
Government Term- 3 (2001 to 2006)
Particulars
Turnover Value Tk. in Million
Market Capitalization Tk. in Million
DSE General Index (DGEN) in Points
Initial Public Offerings Nos.
Market cap to GDP ratio in Percentage
Turnover ratio in Percentage
Average Daily Value Traded Tk. Million
October 10, 2001 October 22, 2006 Change in %
257.85
215.48
(16.43)
70,339.88
282,123.48
301.09
702.30
1,542.44
119.63
45.00
2.57
5.97
132.30
0.367
0.076
(79.16)
132.44
170.63
28.84
Universal Journal of Accounting and Finance 1(2): 42-50, 2013
Chart 3.
47
Government Period 2001 to 2006
Chart 2 shows the daily DSI index and turnover value. The
highest turnover value and DSI Index were Tk. 1065.04
million and 3648.75 points during this term.
Statistical Analysis: In table 7, total 1344 observations
have been used for government term 2. The mean and
median return were (0.002) and (0.022) percent respectively
where the Standard deviation was 2.13 percent.
The highest turnover value and DGEN Index were Tk.
809.27 million and 1,999.71 points during this term.
Statistical Analysis: In table 7, total 1350 observations
have been used for government term 3. The mean and
median returns were 0.067 and 0.01 percent respectively
where the Standard deviation and CV were 1.35 percent and
20.28 respectively.
Government Term 3 (2001 to 2006)
Government Term 4 (2006 to 2009)
Descriptive Observations: In table 4; on October 10,
2001, the turnover value was Tk. 257.85 million, which
stood at Tk. 215.48 million on October 22, 2006 representing
16 percent negative growth. The Market Capitalization was
Tk. 70.34 billion on October 10, 2001, which reached at Tk.
282.12 billion on October 22, 2006, registering 301 percent
growth. DGEN Index was 702.30 points on October 10, 2001,
which increased to 1,542.44 points on October 22, 2006
confirming 120 percent up. The average daily value traded
was Tk. 170.63 million during this period which was Tk.
132.44 million in previous government term demonstrates
28.84 percent appreciation. Market Capitalization to GDP
decreased from 2.57 percent to 5.97 percent during the
tenure. At the beginning of the term, the turnover ratio was
0.367 percent, that decreased by 79.16 percent to 0.076
percent. During the period, a total 45 firms have off-loaded
shares in the capital market.
Chart 3 shows the daily DGEN index and turnover value.
Descriptive Observations: In table 5, on October 31,
2006, the turnover value was Tk. 261.21 million, which
stood at Tk. 4,642.24 million on January 05, 2009,
representing 1,677 percent huge growth. The Market
Capitalization was Tk. 281.40 billion on October 31, 2006,
which reached at Tk. 1,057.95 billion on January 05, 2009,
registering 276 percent growth. DGEN Index was 1,541.65
points on October 31, 2006, which increased to 2,808.45
points on January 05, 2009 confirming 82 percent up. The
average daily value traded was Tk. 1,978.80 million during
this period which was Tk. 170.63 million in previous
government term demonstrates 1,060 percent appreciation.
Market Capitalization to GDP decreased from 5.96 percent
to 15.24 percent during the tenure. At the beginning of the
term, the turnover ratio was 0.093 percent, that increased by
372.71 percent to 0.439 percent. During the tenure, a total 28
firms have off-loaded shares in the capital market.
Table 5. Government Term-4 (2006 to 2009)
Government Term- 4 (2006 to 2009)
Particulars
Turnover Value Tk. in Million
Market Capitalization Tk. in Million
DSE General Index (DGEN) in Points
Initial Public Offerings Nos.
Market cap to GDP ratio in Percentage
Turnover ratio in Percentage
Average Daily Value Traded Tk. Million
October 31, 2006
261.21
281,397.10
1,541.65
5.96
0.093
170.63
January 5, 2009 Change in %
4,642.24
1,677.21
1,057,947.03
275.96
2,808.45
82.17
28.00
15.24
155.70
0.439
372.71
1,978.80
1,059.69
48
Stock Market Performance under Different Government Periods: Evidence from Bangladesh
Chart 4.
Government Period (2006 to 2009)
Chart 5.
Government Period (2009 to 2013)
Table 6.
Government Term-5(2009 to 2013)
Government Term- 5 (2009 to 2013)
Particulars
Turnover Value Tk. in Million
Market Capitalization Tk. in Million
DSE General Index (DGEN) in Points
Initial Public Offerings Nos.
Market cap to GDP ratio in Percentage
Turnover ratio in Percentage
Average Daily Value Traded Tk. Million
January 6, 2009
3,788.71
1,042,968.82
2,756.66
15.02
0.363
1,978.80
April 30, 2013 Change in %
1,364.33
(63.99)
2,166,577.33
107.73
3,618.49
31.26
70.00
23.68
57.66
0.063
(82.67)
7,906.66
299.57
Universal Journal of Accounting and Finance 1(2): 42-50, 2013
49
Table 7. Descriptive Statistics Findings
Descriptive Statistics Findings
Statistical Findings
Mean
Median
Standard Deviation
Coefficient of Variation (CV)
Kurtosis
Skewness
Minimum
Maximum
Number of Observations
Term 1
1991-1996
0.00075
0.00014
0.01628
21.5930
196.3268
1.7979
(0.25079)
0.33098
1,337
Term 2
1996-2001
Chart 4 shows the daily DGEN index and turnover value.
The highest turnover value and DGEN Index were Tk.
5,905.15 million and 3207.89 points during this term.
Statistical Analysis: In table 7, total 514 observations
have been used for government term 4. The mean and
median returns were 0.125 and 0.140 percent respectively
where the Standard deviation and CV were 1. 28 percent and
10.28 respectively
Government Term 5 (2009 to 2013)
Descriptive Observations: In table 6; on January 06,
2009 the turnover value was Tk. 3,788 million, which stood
at Tk. 1,364 million on April 30, 2013 representing 64
percent negative growth. The Market Capitalization was Tk.
1,042.97 billion on January 06, 2009, which reached at Tk.
2,166.58 billion on April 30, 2013 registering 108 percent
growth. DGEN Index was 2,756.66 points on January 06,
2009 which increased to 3,618.49 points on April 30, 2013
confirming 31 percent up. The average daily value traded
was Tk. 7,906.66 million during this period which was Tk.
1978.80 million in previous government term demonstrates
300 percent appreciation. Market Capitalization to GDP
increased from 15.02 percent to 23.68 percent during the
tenure. At the beginning of the term, the turnover ratio was
0.363 percent, that decreased by 82.67 percent to 0.063
percent. During the term, a total 70 firms have off-loaded
shares in the capital market.
Chart 5 shows the daily DGEN index and turnover value.
The Glorious record of single day’s highest turnover value
was Tk. 32,000 million and DSE General Index reached its
highest level at 8,991 points on December 05, 2010.
Statistical Analysis: In table 7, total of 1038 observations
have been used for government term 5. The mean and
median returns were 0.047 and 0.045 percent respectively
where the Standard deviation and CV were 2.058 percent and
43.79 respectively
Major Findings: - a comparative analysis
From the above analyses and table 7, we observe that the
government term 4 has the highest mean and median return
(0.125% & 0.140%) where the term 2 has lowest mean and
(0.00002)
(0.00022)
0.02126
43.9968
1.7536
(0.22204)
0.30366
1,344
Term 3
2001-2006
0.00067
0.00012
0.01352
20.2833
292.5431
11.5671
(0.07095)
0.33930
1,350
Term 4
2006-2009
0.00125
0.00140
0.01284
10.2752
0.6639
0.1083
(0.03921)
0.04737
514
Term 5
2009-2013
0.00047
0.00045
0.02058
43.7875
18.9264
1.5256
(0.08908)
0.22608
1,038
median return (Negative). On the other hand, although the
term 4 has highest mean return, its volatility or risk was
lowest among all the government terms as its standard
deviation is only 1.28 percent which is lowest. The term 4
has also the lowest coefficient of variation (CV) which
measures the risk per unit of return is 10.28. But, even
though the government term 2 has negative return, it has
highest volatility or risk as its standard deviation is 2.13
percent, which is largest.
Apart from government term 2, the current term 5 has the
highest volatility with comparatively lower mean return. In
contrast, the government term 1 and 3 have almost similar
and consistent risk-return pattern as their CV were 21.59 and
20.28 respectively. And surprisingly, these two terms (1 & 3)
were led by the same political party; BNP.
If we further examine the descriptive observations and
table- 2 to 6, we also found that all the market indicators have
comparatively very significant positive growth under
government term 1 and 4 while the government terms 2 and 5
have very poor or negative growth in terms of most of the
indicators.
Another important thing to be noted that the two big
crashes (1996 & 2011) occurred during the government
terms 2 and 5 respectively which are depicted in chart 2 and 5.
The market performance under these two government terms
was also worse than that of rest of the terms. And
coincidentally, the same political party; Bangladesh Awami
League has been at government during these two terms. Thus,
it is evident from the above analysis that the political parties
holding power in government had significant impact on the
stock market performance as the political parties at
government changes; the market performance also changes
significantly.
Khondoker Ibrahim Khaled’s probe report on stock
market crash in 2011 found that market got imbalanced
during the Caretaker government in 2007 which ultimately
translated into a market crash in 2011 during the AL regime.
However, why the market performance during AL regime is
not good comparing to during BNP’s leadership is an area of
further research.
50
Stock Market Performance under Different Government Periods: Evidence from Bangladesh
6. Conclusion
REFERENCES
From our analysis it is evident that the performance of
stock market was better during non-political government
(caretaker) in 2006 to 2009 in all aspects. Under this period,
the average market return was highest while volatility was
lowest and all other market indicators had shown significant
growth. However, if we consider only political governments,
the performance of stock market was best during BNP led
government in 1991 to 1996 in all aspects. During this period,
the average market return was highest while volatility was
low and all other market indicators had shown significant
growth. On contrary, the performance of stock market was
very poor during Awami league regime in 1996 to 2001 in all
aspects. During this period, the average market return was
negative while volatility was highest. Even during the
current Awami league administration, market experiences
very low average return combined with high volatility.
However, in both terms of BNP led government, i.e., 1991 to
1996 and 2001 to 2006, market experienced comparatively
consistent return-volatility relation.
To that end, we may conclude that the market performed
best under the non-political government (caretaker) during
2006-2009 while market performed worse under Awami
league led government during 1996-2001 & 2009-2013.
However, the market performance was well and consistent
under BNP led government during 1991-1996 & 2001-2006.
Therefore, from the above analysis it is evident that the
political parties holding power in government had significant
influence on stock market performance.
Even though Ibrahim Khaled’s probe report on stock
market crash in 2011 has given some comfort to Awami
League that the market got imbalanced or bubble during
earlier government in 2007 which translated into a crash in
their term in 2011, Awami League government cannot
ignore the liability for repeated market crashes (1996 &
2011). However, why market got into crash repeatedly
during Awami League regime, why the market performance
during AL regime is not good comparing to during BNP’s
leadership is an area of further research.
[1]
Ansolabehere, Stephen, John M. De Figueiredo and James M.
Snyder Jr. (2003). Why is there so Little Money in U.S.
Politics? Journal of Economic Perspectives, 17(1), 105–130.
[2]
Beyer, S. B., Jensen, G. R., & Johnson, R. R. (2004). Don’t
worry about the election, just watch the Fed. The Journal of
Portfolio Management, Summer 2004, 101-108.
[3]
Bijon B. Sarma (2012). Election and Democracy in
Bangladesh, the Unknown Riddle and Proposal for
Improvement. File retrieved from:
[4]
http://www.priyoaustralia.com.au/articles/138846-election-a
nd-democracy-in-bangladesh-the-unknown-riddle-and-propo
sal-for-improvement.html.
[5]
Chowdhury, A.R. (1994). Statistical Properties of Daily
Returns from Dhaka Stock Exchange, The Bangladesh
Development Studies, 26(4), 61-76.
[6]
Jedrzej B., Katrin G. and Tomasz P. W. (2006). Political
Orientation of Government and Stock Market Returns,
Working Paper. File retrieved from:
[7]
https://www.econstor.eu/dspace/bitstream/10419/22113/1/p9
2006.pdf
[8]
Nikhar Gaikwad (2013). Presidential Prospects, Political
Connections, and Stock Market Performance. File retrieved
from: www.yale.edu/csap/seminars/gaikwad.pdf.
[9]
Oumar Sy and Ashraf Al Z. (2011). Resolving the
Presidential Puzzle, Financial Management, 40(2), 331–355.
[10] Ray M. V. and Marshall D. N. (2012). The U.S. Presidency
and the Stock Market: A political relationship study of the
market performance, Research in Business and Economics
Journal.
File
retrieved
from:
http://www.aabri.com/manuscripts/121230.pdf.
[11] Roland F. and Michael M. B. (2007). Partisan Politics and
Stock Market Performance: The Effect of Expected
Government Partisanship on Stock Returns in the 2002
German Federal Election, Social Science Research Network,
Public Choice 135(3-4), 131-150.
[12] Santa-Clara, P. & Valkanov, R. (2003). The presidential
puzzle: Political cycles and the stock market, The Journal of
Finance, LVIII (5), 1841-1872.
[13] Share Market Inquiry Report, (2011). The committee is
headed by Khondkar Ibrahim Khaled. Retrieved from
http://www.mof.gov.bd/en/budget/share/report.pdf.


