Chapter 6: Graphs
advertisement
6. GRAPHS
§6.1. Graphs in Mathematics and Computing Science
In mathematics the word “graph” is used to display a function y = f(x) against two axes. But
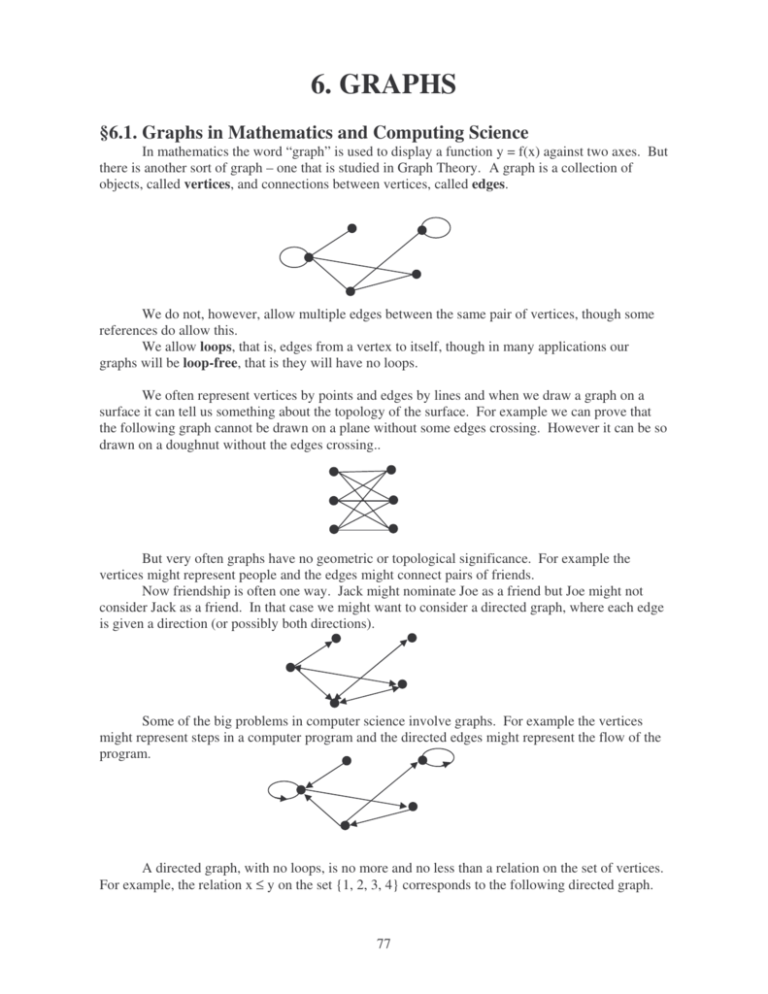
there is another sort of graph – one that is studied in Graph Theory. A graph is a collection of
objects, called vertices, and connections between vertices, called edges.
We do not, however, allow multiple edges between the same pair of vertices, though some
references do allow this.
We allow loops, that is, edges from a vertex to itself, though in many applications our
graphs will be loop-free, that is they will have no loops.
We often represent vertices by points and edges by lines and when we draw a graph on a
surface it can tell us something about the topology of the surface. For example we can prove that
the following graph cannot be drawn on a plane without some edges crossing. However it can be so
drawn on a doughnut without the edges crossing..
But very often graphs have no geometric or topological significance. For example the
vertices might represent people and the edges might connect pairs of friends.
Now friendship is often one way. Jack might nominate Joe as a friend but Joe might not
consider Jack as a friend. In that case we might want to consider a directed graph, where each edge
is given a direction (or possibly both directions).
Some of the big problems in computer science involve graphs. For example the vertices
might represent steps in a computer program and the directed edges might represent the flow of the
program.
A directed graph, with no loops, is no more and no less than a relation on the set of vertices.
For example, the relation x ≤ y on the set {1, 2, 3, 4} corresponds to the following directed graph.
77
2
1
4
3
A reflexive relation will correspond to a graph at each vertex. A symmetric relation will
correspond to an undirected graph.
Sometimes we attach numbers to the edges of a graph. For example the vertices might
represent towns and the edges might represent roads connecting them. The numbers could be the
distances between connected towns.
7
25
15
18
30
The picture need not be drawn to scale and its layout need not represent an actual geometric
layout, if there is one. The picture merely serves to convey the connections, and could be drawn
quite differently. For example the above weighted graph could be redrawn as follows.
25
7
18
30
15
A famous problem in computing science is the so-called Travelling Salesman Problem.
Given a weighted undirected graph, of all the paths that starts at one vertex, visit every other vertex
and return to the one where it started, find one for which the sum of the weights is least.
6
7
7
9
5
25
10
12
35
18
There is a path that goes through each vertex, returning to the start, whose total length is only 74.
Can you find it? Is this the best possible?
Weighting in graphs can apply equally well to directed graphs. For example if some of the
roads in the above example were one-way we would have a weighted directed graph.
6
7
5
7
9
10
25
18
78
12
35
§6.2. Basic Definitions For Graphs
A graph is a set, X, of elements together with a relation on X. We often draw pictures of
graphs, where the elements of X are represented by dots and the relation by a set of arrows
connecting certain dots to others. The elements of X are called vertices and the arrows joining
vertices related by the relation are called edges.
Example 1: The following is a graph on the set {1, 2, 3, 4}:
{(1, 1), (1, 3), (1, 4), (2, 1), (2, 3), (3, 2), (4, 3)}. This can be represented by the following diagram.
There are 4 vertices and 7 edges.
1
4
2
3
If we label the vertices A, B, C, … we can write the edges more concisely. The edges of
this graph
A
D
B
are AA, AC, AD, BA, BC, DC.
C
A loop is an edge (V, V) from a vertex to itself, but in this chapter we shall assume, unless
otherwise stated, that there are no loops.
An undirected graph is one where the relation is symmetric – if U is related to V then V
is related to U. So if there is an arrow in one direction there is always one in the opposite direction.
In an undirected graph there is no need to use arrows since we know that the relation goes in both
directions, so we simply use edges without arrows. A graph with arrows is called a directed
graph. A graph (either directed or undirected) is called weighted if there is a number associated
with each edge.
Example 2: The following is an undirected graph.
Example 3: The following is a weighted undirected graph.
10
5
20
2
22
79
Note that the numbers in this example cannot indicate distances in a geometric graph
because there is a triangle with sides 2, 10 and 20. In a geometric triangle the length of each side
cannot exceed the sum of the other two sides. But the numbers could refer to the capacity of pipes
in a plumbing network. Or the vertices could represent a group of friends and the numbers might
represent the number of telephone conversations between each pair on a given day. Although we
often draw graphs pictorially do not assume that they must always represent something geometric.
A graph is a combinatorial structure where the only consideration is which vertices are
adjacent to which. When we draw a graph the positions of the points representing the vertices are
arbitrary. So are the routes of the edges. The edges need not be straight, they are allowed to cross
over other edges, and they could even wind around in more complicated ways. However we usually
draw a graph in such a way that it gives as simple a picture as possible.
Example 4: The graph in example 2 could be redrawn as in the diagram on the left, but would look
much better when drawn as the one on the right.
1
2
4
3
2
1
3
4
Notice that in the above example it is possible to draw the graph without any of the edges
crossing. This is not always possible, and we will be very much concerned with the problem of
when this is possible and when it is not.
In a graph we say that two vertices are adjacent if there is an edge between them.
Example 5: In example 3, vertices 1 and 2 are adjacent but 2 and 4 are not.
Two graphs X and Y are equivalent if there’s a 1-1 and onto map f: X → Y such that x1 and x2
are adjacent in X if and only if f(x1) and f(x2) are adjacent in Y.
Example 6: The two graphs in example 3 are equivalent. And both are equivalent to the following
graph. (It is essentially the same graph but with the vertices labelled differently.)
B
A
C
D
Example 7: The following list contains all the undirected graphs with 4 vertices or less. They have
been systematically classified according to the number of vertices, V and edges, E.
V=1
E=0
V=2
E=0
80
V=2
E=1
V=3
E=0
V=3
E=1
V=4
E=0
V=4
E=1
V=3
E=2
V=3
E=3
V=4
E=2
V=4
E=3
V=4
E=4
V=4
E=5
V=4
E=6
The complete graph on n vertices, denoted by Kn, is the graph where every vertex is
adjacent to every other vertex. The number of edges in a complete graph on n vertices is clearly
n
the binomial coefficient 2 .
Example 8: The following are the complete graphs on 6 vertices or less.
K1
K2
K3
K4
K5
K6
Another important family of graphs consists of the graphs Km,n for various values of m
and n (they don’t have a name, just a symbol). The graph Km,n has m + n vertices divided into
two subsets, one of size m and the other of size n. Every vertex in one subset is adjacent to every
vertex in the other, but there are no edges connecting two vertices within the same subset.
81
Example 9: The following is K3,3:
This graph was once featured in an Air New Zealand advertisement, where the 6 vertices consisted
of the cities Brisbane, Sydney, Melbourne, Auckland, Wellington and Christchurch. The edges
represented the trans-Tasman routes.
An undirected graph is connected if every pair of distinct vertices are connected by a path.
If a graph is not connected the various parts that are connected are called its components. (A
connected graph has just one component.
Example 10: The following graph is not connected. It has 3 components.
A badly drawn picture of a non-connected graph might make the graph appear connected.
The following graph has 2 components.
A planar graph is one that can be drawn in the plane without the edges crossing. Even if a
graph, as drawn, has crossing edges, it is planar if it is equivalent to one with no crossings. The
graph in example 4 is planar because it can be drawn without edges crossing. But K3,3, in example
9, is not planar. What is the largest value of n for which the completer graph Kn is planar?
§6.3. The Degree of a Vertex
The degree of a vertex in an undirected graph is the number of vertices adjacent to it (in
other words it is the number of edges that have that vertex as one of its endpoints). We denote the
degree of vertex V by deg(V).
Example 11: In the following graph the degrees of the vertices are indicated.
2
3
3
2
7
1
0
2
4
Notice that there are 9 vertices, 12 edges and the sum of the degrees is 24. Is there a
connection between these numbers?
82
Theorem 1: If G is a graph with V vertices and E edges, each degree is at most V − 1 and the
sum of the degrees is 2E.
Proof: The first part of this theorem is obvious. Each edge contributes 2 to the sum of the degrees,
one for each end. Hence the sum of the degrees is twice the number of edges.
Example 12: Prove that there is no graph whose vertices have degrees 1, 2, 2, 2, 3, 4, 4, 5.
Solution: The sum of the degrees is 23, which is odd. Hence such a graph is impossible.
Example 13: Prove that there is no graph whose vertices have degrees 1, 2, 2, 2, 3, 4, 4, 8.
Solution: Since there are 8 vertices the degree of each vertex must be at most 7.
Example 14: Prove that there is no graph whose vertices have degrees 1, 1, 2, 3, 3, 3, 6, 7.
Solution: Since there are 8 vertices the vertex of degree 7 must be at most adjacent to every other
vertex. Removing this vertex, and the 7 edges at that vertex we would get a subgraph with 7
vertices and degrees 0, 0, 1, 2, 2, 2, 5. Removing the vertex of degree 0 we would get a graph with
degrees 1, 2, 2, 2, 5. This is impossible because there are only 4 vertices for the vertex of degree 5
to be adjacent to.
Example 15: Draw a graph G whose vertices have degrees 1, 2, 2, 3, 3, 4, 6, 7.
Solution: There are 8 vertices and so the vertex of degree 7 must be adjacent to every other vertex.
Removing this vertex, and the 7 edges at that vertex we would get a subgraph H with 7 vertices
and degrees 0, 1, 1, 2, 2, 3, 5. Removing the vertex of degree 0 we would get a graph with degrees
1, 1, 2, 2, 3, 5. The vertex of degree 5 would be adjacent to every other vertex in this subgraph.
Hence, as before, we reach a graph K with degrees 0, 0, 1, 1, 2. Clearly this graph must be:
K
Working backwards we see that H and G must be as follows.
H
G
By examining the way the solution was obtained we can see that all graphs whose 8 vertices have
degrees 1, 2, 2, 3, 3, 4, 6, 7 must be equivalent.
§6.4. Walks, Paths and Cycles
A walk in a graph (directed or undirected) is a sequence of edges
(V0, V1), (V1, V2), … , (Vn−1, Vn).
Its length is the number of edges, n. If the edges are distinct the walk is called a path. If, in
addition, Vn = V0 the path is called a cycle.
83
Example 16: In the following graph
B
C
D
E
A
H
F
G
the sequence AB, BC, CG, FH, HD, CB is a walk. We can write it more concisely as
ABCGFHDCB. Because the edge BC is repeated (even though it is in a different direction) it is not
a path. Think of a walk as something you might do along a network of concrete paths in a garden
while a path is the physical collection of paths.
The walk ABCFH is a path since no edge is repeated. Clearly a walk can be of any length
while the length of a path is at most the number of edges. The walk BCGFHAB is a cycle.
§6.5. Trees and Forests
A forest is an undirected graph with no cycles and a tree is a connected forest. The
components of a forest are trees, and they can be drawn in such a way that they resemble the
branches of actual trees.
In a tree there is a unique path from any vertex to any other vertex. A leaf of a tree is a
vertex of degree 1. Often when we draw a tree one of the “leaves” looks more like the root of the
tree, but it is no different to any other leaf. Every tree, except for the tree with 1 vertex, has at least
2 leaves.
Example 17: The following is a forest with 4 components (each of which is a tree), 20 vertices and
16 edges.
There is a connection between these three numbers. For a forest the number of components
plus the number of edges is equal to the number of vertices.
Theorem 2: If a forest has C components, V vertices and E edges then
V = E + C.
Proof: Choose an edge, and let its endpoints be A, B. Removing this edge (but not the vertices)
will split one of the components into two. If it remained connected there would be a path from A to
B that does not use the deleted edge, and so in the original graph there would be a cycle. But
forests do not have any cycles.
The new graph will have one less edge and one more component, so E + C will remain
constant. We can continue removing edges until there are none left and we have V vertices and 0
edges. Each vertex will now be in a separate component and so we will have V components, so E +
C will be equal to V. Throughout the process neither V nor E + C will have changed so V = E + C
for the original graph.
84
§6.6. Euler’s Formula
A graph is defined to be planar if it can be drawn on a plane so that edges do not cross. So
K3,3 is not planar. But K4,2 is:
So is K4:
When a planar graph is drawn on a plane in such a way we call it a map. The regions
enclosed by the edges are called faces. We often denote the numbers of vertices, faces and edges
by V, F and E respectively.
Example 18: Some examples of maps, together with the numbers of vertices, faces and edges.
V = 11
F= 6
E = 16
V= 9
F= 8
E = 16
Note that in each case V + F − E = 1. This is always the case for planar graphs.
Theorem 3: (Euler’s Formula for the Plane)
For any connected planar map V + F − E = 1.
Proof: Define the Euler characteristic of a map to be χ = V + F − E.
If we remove an edge from a map that separates two faces and combine those two faces the value of
χ will be unchanged..
different
faces
same face
85
V→V
F→F−1
E→E−1
χ → χ.
We continue this operation until there is only one face remaining
Applying the above operation we can convert any map to a tree. If there are n edges in this tree
there are n + 1 vertices by Theorem 3 and so χ = (n + 1) + 0 − n = 1.
Example 19:
V = 11
F= 6
V = 11
F=5
V = 11
F=4
V = 11
F= 3
V = 11
F= 2
V = 11
F=1
V = 11
F=0
Example 20: Explain why the following example does not contradict Theorem 4.
V=8
V=8
V=8
V=8
F=4
F=3
F=2
F=2
E = 11
E = 10
E=9
E=8
χ=1
χ=1
χ=1
χ=2
Solution: In deleting edges we must ensure that they are the boundary of separate faces. The last
edge to be removed does not do this.
Since a disk can be cut out of a sphere, any planar graph can be drawn on a sphere without
edges crossing. On the other hand, if we can draw a graph on a sphere, without edges crossing, we
can cut out a small hole in the middle of one of the faces and stretch the rest flat. In this way we
will have a picture of the graph on a plane.
So a graph is planar if and only if it can be drawn, without crossings, on a sphere. This is
useful because often a sphere is more convenient to work with.
Theorem 4: (Euler’s Formula for a Sphere)
For any connected map drawn on a sphere:
V + F − E = 2.
Proof: When drawn on a sphere we have one extra face
86
A polyhedron (plural “polyhedra”) is a surface in 3 dimensions made up of planar faces,
each of which is a polygon. These faces meet in straight edges and the edges meet in vertices. The
network of vertices and edges is a graph and if the surface is expanded to a surface (imagine that the
faces are made of some material that stretches and it is pumped up) we get a planar graph drawn on
a sphere. So for polyhedra V + F − E = 2.
Example 21: Maps on a sphere:
V=8
V=4
F= 6
E = 12
∴ χ = 8 + 6 − 12 = 2.
F=4
E=6
∴ χ = 5 + 5 − 8 = 2.
§6.7. Planar Graphs
To prove that a graph is planar we can simply draw it, with edges not crossing. But how do
we show that a graph, such as, K3,3 or K5 is not planar? The technique discussed here is to work
out the average number of edges per face and compare this to the smallest number of edges per
face. But wait a minute. Graphs do not have faces!
That is true, but a graph drawn on the plane without edges crossings becomes a map, and
maps have faces. So we suppose that the graph is planar, that is, it can be drawn on a sphere. But
how can we count the number of faces if we are only supposing that the graph can be embedded?
The answer is to use Euler’s formula for a sphere:
V+F−E=2
Example 25: K5 is not planar.
Proof: For K5 we have V = 5 and E = 10.
Suppose that K5 is planar. Then embedding it in a sphere we can deduce that the number of faces
must be:
F = 2 + E − V = 7.
2E 20
6
The average number of edges per face must therefore be F = 7 = 27 .
2E
E
Why F and not just F ? The reason is that every edge is associated with two faces – one on each
side. So if you were to split each edge lengthwise, so that each half edge was associated with only
one face, you’d have 2E half edges to share among the F faces.
87
Now we wanted to prove that K5 can’t be embedded in a sphere and we started out by
supposing that it can be. We’re clearly looking for a contradiction. So what’s contradictory about
6
the average number of edges per face being 27 ?
What is wrong is that it’s less than 3. Every face must be surrounded by at least 3 edges. (A
face bounded by 2 edges would require that the two edges connect the same two vertices, and a face
bounded by just 1 edge would mean that the graph has a loop.)
Now the average of a collection of numbers cannot be less than the smallest of them. So
here we have our contradiction!
Example 22: K3,3 is not planar.
Proof: Here V = 6 and E = 9.
Suppose that K3,3 can be embedded in a sphere. The resulting map would have to have F faces
where 6 + F − 9 = 2, that is it must have 5 faces.
18
3
The average number of edges per face would therefore be 5 = 35 .
This is not less than 3, so where’s the contradiction? The contradiction is that it’s less than 4. You
see, in this graph there are no cycles of length 3. Each edge takes you from one set of vertices to
the other. Going along another edge must take you back to a different vertex in the first set. The
smallest cycles in this graph therefore have length 4. The boundary of a face must be a cycle in the
graph. So the smallest number of edges for each face is 4. But the average of these numbers is less
than 4. This can’t be, and so we have our contradiction.
The girth of a graph is the length of the shortest cycle. The girth of K5 is 3 but the girth of
K3,3 is 4. We get a contradiction if the average number of edges per face is less than the girth.
Theorem 5: If a connected graph has V vertices, E edges and a girth of g such that
2E
< g then the graph is not planar.
2+E−V
88
