Results
advertisement
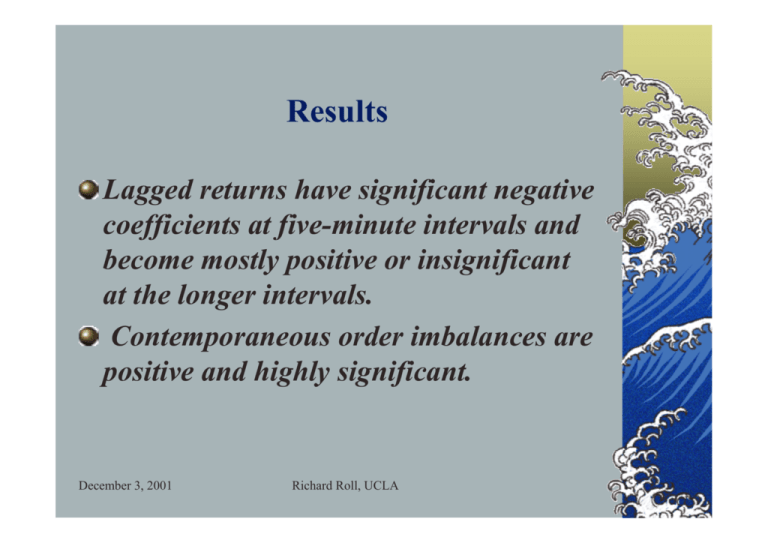
Results Lagged returns have significant negative coefficients at five-minute intervals and become mostly positive or insignificant at the longer intervals. Contemporaneous order imbalances are positive and highly significant. December 3, 2001 Richard Roll, UCLA Results for Lagged OIB OIB#t-1 is positive at five minutes, though insignificant. By ten minutes, it becomes negative and significant. OIB$t-1 remains positive. Pattern persists out to sixty minutes but OIB$t-1 is insignificant. Coefficients decline as trading interval lengthens Note that the contemporaneous OIB coefficients do not decline much. December 3, 2001 Richard Roll, UCLA Table 4.A. Returns on lagged returns and OIB Large Stocks, 1996 Explanatory Variable Midpoint Returnt-1 OIB#t OIB#t-1 OIB$t OIB$t-1 R2 Return Interval (minutes) Five Ten Fifteen Thirty Dependent Variable is the Midpoint Returnt, Large Stocks, 1996 -0.038 -0.066 -0.050 -0.095 -0.025 -0.083 0.037 -0.028 (-5.42) (-7.40) (-5.55) (-15.8) (-2.44) (-9.89) (3.33) (-2.27) (-3.55) (-6.52) (-3.29) (-6.44) (-1.31) (-4.51) (1.52) (-0.95) 8.78 8.94 8.54 7.53 (7.10) (6.83) (6.81) (6.28) (37.5) (30.1) (25.1) (16.9) 3.51 -0.943 -1.40 -1.79 (1.38) (-3.58) (-5.24) (-5.51) (0.30) (-3.89) (-4.93) (-4.21) 4.60 4.96 4.99 4.91 (20.1) (11.6) (11.2) (10.7) (46.3) (38.1) (32.7) (24.9) 0.829 0.481 0.349 0.092 (5.45) (4.44) (3.35) (0.97) (6.48) (2.67) (1.52) (-0.11) 15.8 19.7 19.1 24.8 19.7 26.8 19.0 30.3 December 3, 2001 Richard Roll, UCLA Sixty 0.090 (5.99) (2.26) 6.77 (6.10) (10.8) -2.23 (-6.05) (-3.71) 18.6 -0.009 (-0.80) (-0.12) 4.95 (10.7) (17.0) 0.007 (0.05) (-0.31) 32.8 Traces of two types of investors Smaller traders, (weighted equally in OIB#) more likely to be “naïve”?? Their order imbalances offset by arbitrageurs and/or specialists. This takes at least ten minutes. Relative sizes of coefficients for OIB#t and OIB#t-1 give approximate proportion of naïve trades that are offset. At ten minutes, the initial price impact is offset by about eleven percent (-0.943/8.94) while at 15, 30, and 60 minutes it is offset by roughly 16%, 24%, and 33%, respectively. December 3, 2001 Richard Roll, UCLA Astute traders Lagged OIB$ significantly positive for five, ten, and fifteen minutes (large stocks, 1996). Insignificant at thirty minutes. Traders respond to larger orders by jumping on the bandwagon. Rapid response; notice relative sizes of contemporaneous and lagged coefficients for OIB$. Five minutes: lagged coefficient is about 18 percent as large Percentage drops to 10%, 7%, 2%, and 0.1% as interval lengthens from 10 to 60 minutes. December 3, 2001 Richard Roll, UCLA Better arbitrage in 1998? OIB#t-1 declines as return interval lengthens but it is negative even at five minutes, (1998, large stocks) Suggests that arbitrageurs were intervening more quickly with countervailing trades in 1998. OIB$t-1 shows no bandwagon effect in 1998 negative after five minutes but much smaller (in absolute value) than OIB#t-1 At sixty minutes, about 36% of OIB# is reversed (-2.87/7.89) while only about 10% of OIB$ is reversed (-.455/4.43). Larger orders contain more accurate information? December 3, 2001 Richard Roll, UCLA Table 4.B. Returns on lagged returns and OIB Large Stocks, 1998 Explanatory Variable Midpoint Returnt-1 OIB#t OIB#t-1 OIB$t OIB$t-1 R2 Return Interval (minutes) Five Ten Fifteen Thirty Dependent Variable is the Midpoint Returnt, Large Stocks, 1998 -0.018 -0.044 0.00 -0.043 0.007 -0.045 0.055 -0.023 (-2.53) (-5.28) (0.01) (-5.75) (0.52) (-4.00) (4.79) (-2.55) (-1.68) (-4.36) (0.11) (-3.11) (0.52) (-2.68) (2.37) (-0.32) 11.0 10.36 10.01 9.05 (10.5) (9.87) (9.62) (9.85) (50.9) (37.0) (30.8) (21.4) -0.864 -1.47 -1.75 -2.12 (-5.30) (-7.01) (-7.70) (-9.26) (-4.71) (-5.75) (-5.90) (-5.57) 4.56 4.65 4.69 4.59 (16.9) (17.4) (17.2) (17.8) (48.8) (37.8) (32.9) (24.7) 0.023 -0.167 -0.221 -0.423 (0.44) (-2.59) (-3.15) (-4.97) (0.12) (-1.22) (-1.46) (-2.10) 21.7 19.9 22.9 22.9 23.8 25.5 24.0 28.5 December 3, 2001 Richard Roll, UCLA Sixty 0.106 (8.83) (2.61) 7.89 (8.93) (13.2) -2.87 (-10.2) (-4.77) 22.4 -0.014 (-1.06) (-0.39) 4.43 (17.4) (17.0) -0.455 (-4.30) (-1.73) 30.8 Mid-Cap Stocks Similar in many respects to large stocks. Coefficient of the contemporaneous OIB always positive and larger than for large-cap stocks. ⇒a given OIB has a larger impact on mid- cap stocks. ⇒Inventory and asymmetric information are more important for stocks that trade less frequently December 3, 2001 Richard Roll, UCLA Table 4.C. Returns on lagged returns and OIB Mid-Cap, 1996 Explanatory Variable Midpoint Returnt-1 OIB#t OIB#t-1 OIB$t OIB$t-1 R2 Return Interval (minutes) Five Ten Fifteen Thirty Dependent Variable is the Midpoint Returnt, Mid-Cap Stocks, 1996 -0.052 -0.009 -0.069 -0.058 -0.056 -0.045 -0.003 -0.028 (-2.28) (-0.30) (-5.17) (-3.62) (-3.48) (-3.01) (-0.22) (-1.84) (-5.66) (-3.62) (-4.03) (-3.88) (-2.44) (-2.69) (-0.25) (-0.85) 19.8 24.2 23.6 22.02 (10.4) (8.33) (8.77) (9.26) (24.8) (23.2) (19.8) (14.4) 6.42 1.59 1.52 -1.32 (5.57) (1.69) (1.88) (-2.36) (7.94) (1.83) (0.47) (-0.78) 6.85 8.15 8.72 9.77 (10.2) (10.5) (10.91) (10.79) (20.2) (17.8) (15.92) (12.67) 2.43 1.41 1.17 0.588 (5.45) (2.77) (4.79) (2.15) (6.86) (3.21) (2.01) (0.82) 17.5 9.88 23.2 11.6 24.7 13.3 26.8 18.1 December 3, 2001 Richard Roll, UCLA Sixty 0.024 (0.97) (0.63) 20.2 (8.37) (9.70) -2.87 (-3.46) (-1.66) 28.0 -0.042 (-1.66) (-0.59) 10.4 (7.95) (8.88) 0.716 (1.35) (0.32) 21.0 Differences between the mid-cap and large stock groups Coefficient of lagged mid-cap return significantly negative in some cases out to thirty minutes. Lagged OIB#t-1 not negative until thirty (fifteen) minutes in 1996 (1998). ⇒ arbitrage takes a bit longer for mid-cap stocks. OIB$t-1 coefficient declines as interval lengthens but is negative only after thirty minutes in 1998. ⇒Slower arbitrage activity in Mid-Cap group December 3, 2001 Richard Roll, UCLA Table 4.D. Returns on lagged returns and OIB Mid-Cap, 1998 Explanatory Variable Midpoint Returnt-1 OIB#t OIB#t-1 OIB$t OIB$t-1 R2 Return Interval (minutes) Five Ten Fifteen Thirty Dependent Variable is the Midpoint Returnt, Mid-Cap Stocks, 1998 -0.033 0.001 -0.017 -0.012 -0.022 -0.034 0.009 -0.035 (-3.54) (0.09) (-1.63) (-1.30) (-2.33) (-4.81) (0.84) (-2.62) (-3.63) (0.55) (-1.39) (-1.14) (-1.38) (-2.05) (0.52) (-1.22) 23.8 25.6 25.90 23.9 (12.6) (11.7) (10.7) (10.3) (46.2) (37.7) (32.3) (22.9) 5.18 0.225 -1.82 -3.91 (5.14) (0.37) (-3.54) (-9.65) (7.40) (-0.59) (-2.49) (-3.67) 6.28 7.08 7.61 8.01 (6.58) (6.61) (6.39) (6.18) (25.6) (20.8) (18.2) (13.8) 1.51 0.690 0.135 -0.038 (4.93) (3.38) (1.17) (-0.27) (5.06) (1.68) (0.38) (-0.05) 19.4 6.68 22.9 8.03 24.6 9.06 25.3 10.7 December 3, 2001 Richard Roll, UCLA Sixty 0.061 (3.56) (1.68) 21.67 (9.97) (14.9) -6.23 (-9.18) (-3.95) 25.4 -0.017 (-0.93) (-0.35) 8.42 (6.44) (10.2) -0.509 (-1.40) (-0.66) 13.6 I’m done Thanks for your kind attention December 3, 2001 Richard Roll, UCLA December 3, 2001 Richard Roll, UCLA
