Revenues Operating Income Income from operating activities Net
advertisement
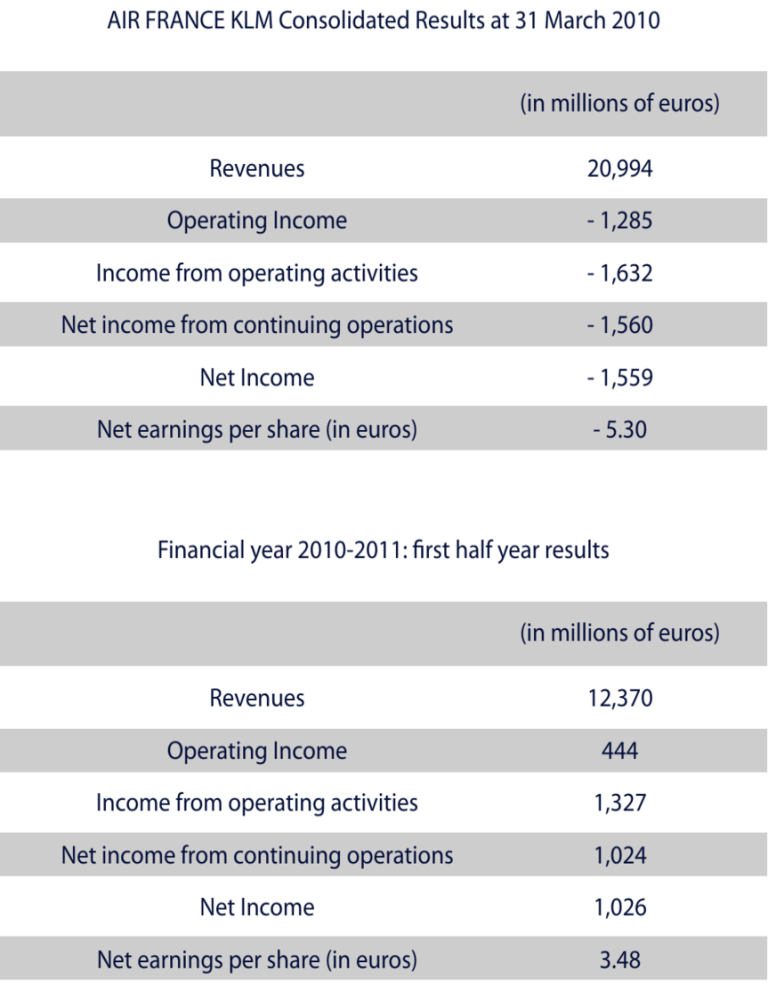
AIR FRANCE KLM Consolidated Results at 31 March 2010 (in millions of euros) Revenues 20,994 Operating Income - 1,285 Income from operating activities - 1,632 Net income from continuing operations - 1,560 Net Income - 1,559 Net earnings per share (in euros) - 5.30 Financial year 2010-2011: first half year results (in millions of euros) Revenues 12,370 Operating Income 444 Income from operating activities 1,327 Net income from continuing operations 1,024 Net Income 1,026 Net earnings per share (in euros) 3.48 AIR FRANCE KLM Passenger Traffic at 31 March 2010 Destinations Number of passengers (in thousands) Revenues (in €bn) Europe 123 48,492 5,921 North America 23 6,835 2,407 Latin America 11 2,181 1,223 Asia / Pacific 22 5,397 2,393 Africa/ Middle East 50 5,484 2,372 Caribbean / Indian Ocean 15 3,005 1,173 244 71,394 15,489 Total Passenger business for the first half of 2010-2011 Six months to 30th September 2010 Traffic (RPK millions) 105,739 Capacity (ASK millions) 126,993 Load factor 83,3% Total passenger revenues (€m) 9,493 Revenues from scheduled passenger business (€m) 9,061 Unit revenue per RPK (€ cts) 8.57 Unit revenue per RPK ex currency Unit revenue per ASK (€ cts) Unit revenue per ASK ex currency Unit cost per ASK (€ cts) Unit cost per ASK at constant currency and fuel price Operating income (€m) 7.14 6.80 311 AIR FRANCE KLM Cargo Business at 31 March 2010 Number of tons (in thousands) Revenues (in millions of euros) Europe 56 53 North and South America 527 790 Asia / Pacific 529 840 Africa / Middle East 288 476 Caribbean/ Indian Ocean 64 154 1,464 2,313 Total Cargo business for the first half of 2010-2011 Six months to 30th September 2010 Traffic (RTK millions) 5,684 Capacity (ATK millions) 8,393 Load factor 67.7% Total cargo business revenues (€m) 1,560 Revenues from the transportation of 1,475 Unit revenue per RTK (€ cts) 25.96 Unit revenue per RTK ex currency Unit revenue per ATK (€ cts) Unit revenue per ATK ex currency Unit cost per ATK (€ cts) Unit cost per ATK on constant currency and fuel price Operating income (€m) 17.58 17.10 18 AIR FRANCE KLM MRO Business in 2009-10 Number of aircraft handled 1,260 Total Revenues (in millions of €) 2,947 External Revenues (in millions of €) 956 Operating income (in millions of €) 81 AIR FRANCE KLM MRO Business for the first half of 2010-2011 Total Revenues (in millions of €) 532 Operating income (in millions of €) 81 Workforce as of 31 December 2009 (Permanent & short-term contacts) Air France KLM Air France Subsidiaries KLM Subsidiaries Ground staff 41,333 17,668 9,000 5,014 Flight attendants 15,081 8,325 1,209 1,506 Cockpit crew 4,272 2,707 1,296 956 Total 60,686 28,700 11,505 7,476 AIR FRANCE KLM Fleet at 31 March 2010 Air France Group KLM Group Total Long-haul 99 61 160 Medium-haul 14 48 192 Regional 140 44 184 Total other fleet 7 41 48 Cargo 6 4 10 Total 396 198 594 Fleet AIR FRANCE KLM fleet for the first half of 2010-2011 Air France Group KLM Group Total Long-haul 104 61 165 Medium-haul 145 46 191 Regional 125 67 192 Cargo 6 4 10 Total 380 178 558 Fleet
