Force and Acceleration
advertisement
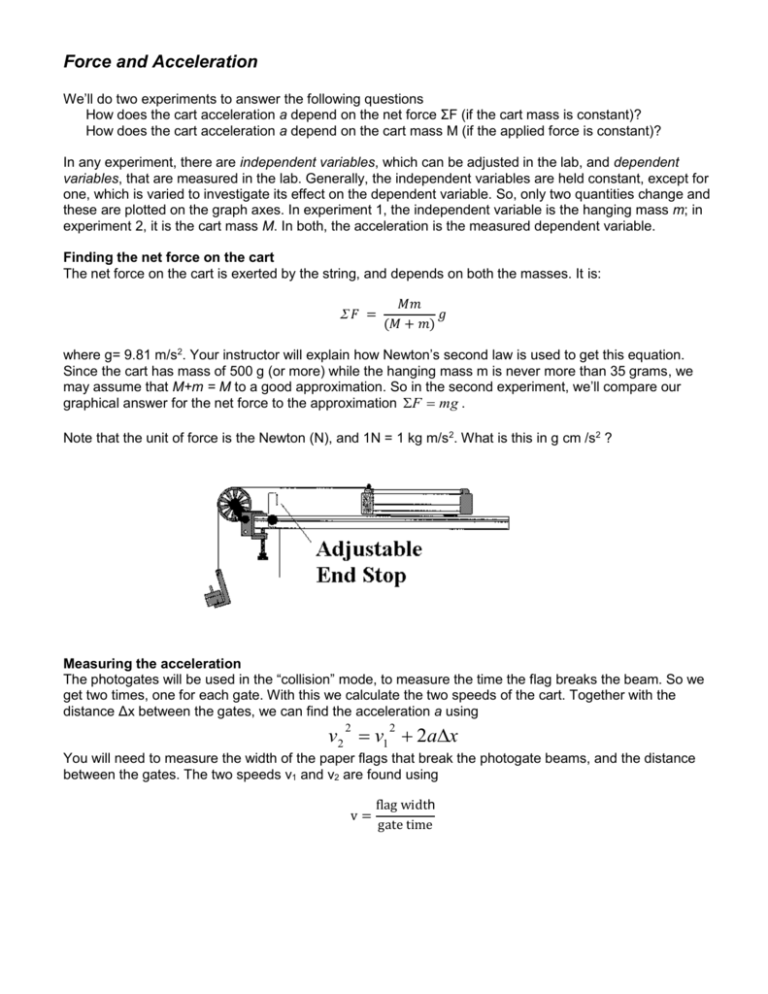
Force and Acceleration We’ll do two experiments to answer the following questions How does the cart acceleration a depend on the net force ΣF (if the cart mass is constant)? How does the cart acceleration a depend on the cart mass M (if the applied force is constant)? In any experiment, there are independent variables, which can be adjusted in the lab, and dependent variables, that are measured in the lab. Generally, the independent variables are held constant, except for one, which is varied to investigate its effect on the dependent variable. So, only two quantities change and these are plotted on the graph axes. In experiment 1, the independent variable is the hanging mass m; in experiment 2, it is the cart mass M. In both, the acceleration is the measured dependent variable. Finding the net force on the cart The net force on the cart is exerted by the string, and depends on both the masses. It is: 𝐹 = 𝑀𝑚 𝑔 (𝑀 + 𝑚) where g= 9.81 m/s2. Your instructor will explain how Newton’s second law is used to get this equation. Since the cart has mass of 500 g (or more) while the hanging mass m is never more than 35 grams, we may assume that M+m = M to a good approximation. So in the second experiment, we’ll compare our graphical answer for the net force to the approximation F mg . Note that the unit of force is the Newton (N), and 1N = 1 kg m/s2. What is this in g cm /s2 ? Measuring the acceleration The photogates will be used in the “collision” mode, to measure the time the flag breaks the beam. So we get two times, one for each gate. With this we calculate the two speeds of the cart. Together with the distance Δx between the gates, we can find the acceleration a using v2 v1 2ax 2 2 You will need to measure the width of the paper flags that break the photogate beams, and the distance between the gates. The two speeds v1 and v2 are found using v= flag width gate time Timer instructions: 25-180: Hit power. Choose Menu, and down arrow until you get Collision mode; press enter. Press the Display button until you have “.9999” and press enter. For Memories choose one, by pressing up or down and enter. Now take data. It will be in A1 and B1. Figure out for yourself which number goes with which gate Press clear before taking more data. Please unplug the unit when not in use to avoid it overheating. 25-160: Menu; press left/right arrows until you get Collision mode; Use down/up arrows to select one sample; press enter; Press Digits button until you have “0.0000” For each run: Press start. Don’t worry about the internal clock that starts running – it’s not measuring the gate time. Run the cart through the gates to take data. The times can be found by using up/down and left/right. Figure out for yourself which number goes with which gate Press clear before hitting start to do the next run. Please unplug the unit when not in use to avoid it overheating. PASCO ME 8930: For this timer, you need a double flag as pictured. Turn on power; Use button 1 to select ‘speed’ Use button 2 to select ‘collision’ To start taking data, press button 3 (you will see an asterisk) After the car has passed through each gate, hit button 3 Cycle between the two readings by hitting button 1 Figure out for yourself what reading goes with what gate The 8930 unit gives speeds in cm/s, calculated by assuming the flag is one centimeter wide. You will find it easier to cut a paper flag that is wider than that, but will then need to correct the speed reading. To make the correction, multiply the reading by the number of centimeters between the front edges of the two parts of your flag. For the flag pictured, multiply by 3.0 to get the speed in cm/s. Issues: The arms of each gate need to be aligned so the beam travels from the one to the other. If the unit does not appear to be recording a time, the fix might be to wiggle the arms slightly to correct the alignment. Force and Acceleration Cover Page Day:_____ Time: _______ Name _________________ Partner: Experiment 1: Make a plot of net force versus acceleration, keeping the cart mass M constant. The hanging mass m is varied: use 25g (ie hanger plus 20g), 30g, 35g,40g, …. Turn in: 1. Excel data table 1. Include all information listed on the handout table. 2. Graph of net force versus acceleration (with best-fit line and equation) 3. Give the following results: Slope of graph: ______________________ Mass of cart from graph: ______________________ Write down the equation for line on the graph, and so explain how the cart mass is found: Cart mass measured with a scale: ______________________ Experiment 2: Take data with a fixed hanging mass of 35 grams. Measure the acceleration of the cart for several cart masses: start with an empty cart, then add 100g, 200g, 300g, 400g, …, 900g. Turn in: 4. Excel data table 2. Include all information on the handout table. 5. Excel graph of acceleration vs. cart mass M 6. Excel graph of ln a versus ln M (with best-fit line and equation) 7. Fill in the following: Intercept from graph: __________________________ The equation for the acceleration is a=ΣF/M. The variables are a and M. Do the logarithmic analysis in the space below, show the plotted variables with square [brackets], and so explain how the net force is found from the slope or intercept. First, do using SYMBOLS ONLY: Now use this to calculate the numerical value of the net force on the cart. Show your work: Net force as calculated: T = _______________________ Net force calculated from T ≈ mg: T = _______________________ What to turn in: i) This completed cover sheet with hand-entered data on back, ii) Graph F vs a with Table 1, iii) Graph a vs M and Table 2 iv) Graph ln a vs ln M Your pages must be stapled, and in the correct order. You may include table 1 on the same page as the F vs. a graph, and you may combine the next two graphs on one page if you wish. Name: 1. Finding the mass M of the cart by varying the hanging mass m Flag width: Hanging mass(g) Unloaded cart mass M = Distance: t1 (s) t2 (s) v1 (cm/s) v2 (cm/s) accel (cm/s2) Net Force ( ) Enter the original data by hand in the first three columns. Then create this table in Excel, and calculate the remaining columns using the software. 2. Finding the force applied by the string by varying the cart mass M Flag width: Mass added to cart (g) 0 Total cart mass M (g) Hanging mass m = Distance: t1 (s) t2 (s) v1 (cm/s) v2 (cm/s) accel (cm/s2) ln (M in grams) 100 200 300 400 500 600 700 800 900 Enter the original data by hand in the third and fourth columns. Then create this table in Excel, and calculate the remaining columns using the software. ln (a in cm/s2)


