Force vs acceleration
advertisement
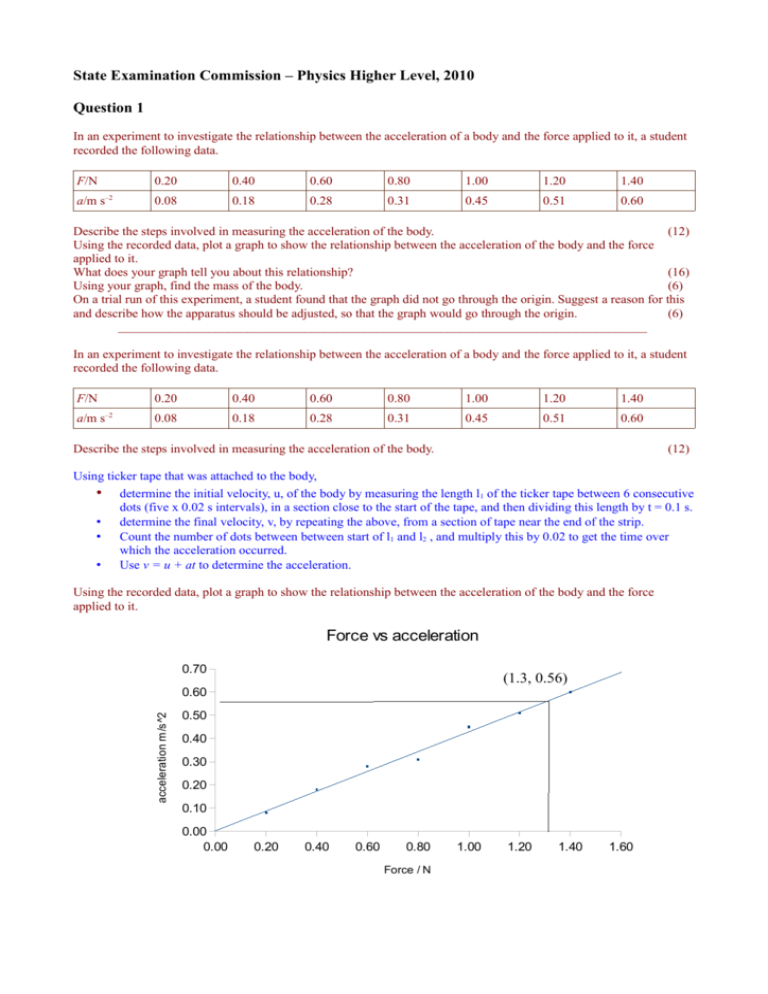
State Examination Commission – Physics Higher Level, 2010 Question 1 In an experiment to investigate the relationship between the acceleration of a body and the force applied to it, a student recorded the following data. F/N a/m s –2 0.20 0.40 0.60 0.80 1.00 1.20 1.40 0.08 0.18 0.28 0.31 0.45 0.51 0.60 Describe the steps involved in measuring the acceleration of the body. (12) Using the recorded data, plot a graph to show the relationship between the acceleration of the body and the force applied to it. What does your graph tell you about this relationship? (16) Using your graph, find the mass of the body. (6) On a trial run of this experiment, a student found that the graph did not go through the origin. Suggest a reason for this and describe how the apparatus should be adjusted, so that the graph would go through the origin. (6) __________________________________________________________________________________ In an experiment to investigate the relationship between the acceleration of a body and the force applied to it, a student recorded the following data. F/N a/m s –2 0.20 0.40 0.60 0.80 1.00 1.20 1.40 0.08 0.18 0.28 0.31 0.45 0.51 0.60 Describe the steps involved in measuring the acceleration of the body. (12) Using ticker tape that was attached to the body, • determine the initial velocity, u, of the body by measuring the length l1 of the ticker tape between 6 consecutive dots (five x 0.02 s intervals), in a section close to the start of the tape, and then dividing this length by t = 0.1 s. • determine the final velocity, v, by repeating the above, from a section of tape near the end of the strip. • Count the number of dots between between start of l1 and l2 , and multiply this by 0.02 to get the time over which the acceleration occurred. • Use v = u + at to determine the acceleration. Using the recorded data, plot a graph to show the relationship between the acceleration of the body and the force applied to it. Force vs acceleration 0.70 (1.3, 0.56) acceleration m/s^2 0.60 0.50 0.40 0.30 0.20 0.10 0.00 0.00 0.20 0.40 0.60 0.80 Force / N 1.00 1.20 1.40 1.60 What does your graph tell you about this relationship? (16) It shows that the bodies acceleration is proportional to the force applied to it (straight line through origin) Using your graph, find the mass of the body. (6) Slope of graph = a/F = 0.56/1.3 = 0.43 => m = F/a = 2.32 kg On a trial run of this experiment, a student found that the graph did not go through the origin. Suggest a reason for this and describe how the apparatus should be adjusted, so that the graph would go through the origin. (6) Perhaps there was another force acting throughout the experiment, for example, friction. The experiment should be adjusted to eliminate frictional effects, perhaps by inclining the plane so that the body moves down it with constant velocity once given a slight nudge.

