Chemistry 201 - C
Structure Determination: Mass
Spectrometry and Infrared
Spectroscopy
This presentation was created by
Professor Carl H. Snyder
Chemistry Department
University of Miami
Coral Gables, FL 33124
CSnyder@miami.edu
Copyright 2004 by Carl H. Snyder,
University of Miami. All rights
reserved.
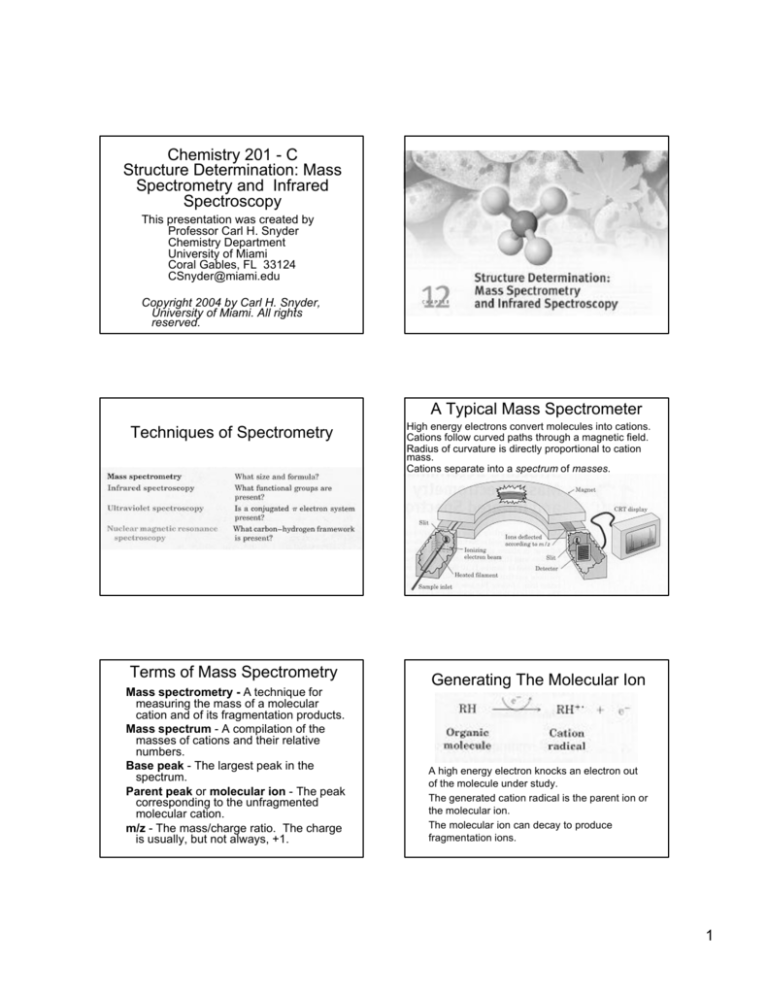
A Typical Mass Spectrometer
Techniques of Spectrometry
Terms of Mass Spectrometry
Mass spectrometry - A technique for
measuring the mass of a molecular
cation and of its fragmentation products.
Mass spectrum - A compilation of the
masses of cations and their relative
numbers.
Base peak - The largest peak in the
spectrum.
Parent peak or molecular ion - The peak
corresponding to the unfragmented
molecular cation.
m/z - The mass/charge ratio. The charge
is usually, but not always, +1.
High energy electrons convert molecules into cations.
Cations follow curved paths through a magnetic field.
Radius of curvature is directly proportional to cation
mass.
Cations separate into a spectrum of masses.
Generating The Molecular Ion
A high energy electron knocks an electron out
of the molecule under study.
The generated cation radical is the parent ion or
the molecular ion.
The molecular ion can decay to produce
fragmentation ions.
1
Formation and Fragmentation
of the Molecular Ion of CH4
Mass Spectrum of Methane
(MW=16)
Parent peak is base peak: m/z = 16
Very small peak at m/z = 17 is due to C-13 or H-2
Methane loses an electron to form a radical
cation, the molecular ion.
The molecular ion loses hydrogen atoms
(radicals) to form fragmentation ions.
Mass Spectrum of Propane
(MW=44)
Mass Spectrum of
2,2-Dimethylpropane (MW=72)
Parent peak or molecular ion at m/z=44
Base peak at m/z=29 corresponds to a loss of
CH3• (44-15=29) to form CH3-CH2+
Some compounds do not show a molecular ion in their
mass spectra.
The base peak, m/z=57, corresponds to loss of a methyl
radical to yield a relatively stable tert-butyl cation radical.
Mass Spectrum of Hexane
(MW=86)
Fragmentation Pattern for Hexane
Complex spectrum results from loss of methyl
and melthylene groups.
Large peaks appear as m/z’s that reflect losses
of CH3 and CH2 radicals.
2
and
Problem #1 Ethylcyclopentane
methylcyclohexane. Which is
and 2-hexene.
Problem #2 2-Methyl-2-pentene
Which is which?
which?
The Electromagnetic
Spectrum
Definitions Illustrated
Definitions
Wavelength - λ - Distance from crest to crest (cm)
Frequency - ν - Waves per unit time (sec-1 or hertz, Hz;
1Hz = 1 sec-1)
Amplitude - Wave height; little used in spectometry
Energy of radiation is directly proportional to
frequency, inversely proportional to wavelength
The Electromagnetic
Spectrum
3
Typical Infrared Absorption
Spectrum - Ethyl Alcohol
CH3-CH2-OH
Infrared Characteristics
Wavelength expressed in µm, micrometers,
1 x 10⁻⁴ cm = 1 x 10⁻⁶ m
Frequency expressed in wavenumbers, 1/λ, or
cm-1
Infrared spectrum: 400 - 4000 cm-1
The Covalent Bond of H2
The Energy Diagram
The Covalent Bond of H2 -The Energy Diagram
The curve represents the energy of the system as a
function of the internuclear distance.
The curve represents the energy of the system as a
function of the internuclear distance.
The Covalent Bond of H2 -The Energy Diagram
zero point
vibration
The Origin of Infrared Absorption
Increase in
vibrational
energy
Quantized
vibrational states
E = hν
∆Ε = h∆ν
The curve represents the energy of the system as a
function of the internuclear distance.
4
The Origin of Infrared Absorption
Multiple Absorptions Due To
Multiple Modes of Vibration
Two modes of spectral interpretation:
Fingerprint: Matching of spectra
Rational interpretation: Assignment of individual
absorption bands.
Specific absorption regions can be associated
with individual functional groups.
Ε = hν
ν
Selected Functional Group
Assignments
Summary: C-H, O-H
Stretching
Summary: C-H, O-H
Stretching
Summary: C-H, O-H
Stretching
5
Summary: C-H, O-H
Stretching
Summary: C=O Stretching
Summary: C=O Stretching
Summary: C=O Stretching
CH3-CH2-OH Revisited
C-H Stretch, -ane, -ene, -yne
Strong, broad band 3200-3700 cm-1, -OH
Strong bands just below 3000 cm-1, alkyl C-H
Remaining bands can be used for fingerprint
identification.
6
End
Structure Determination: Mass
Spectrometry and Infrared
Spectroscopy
7

