Comparison between Inter-rater Reliability and Inter
advertisement
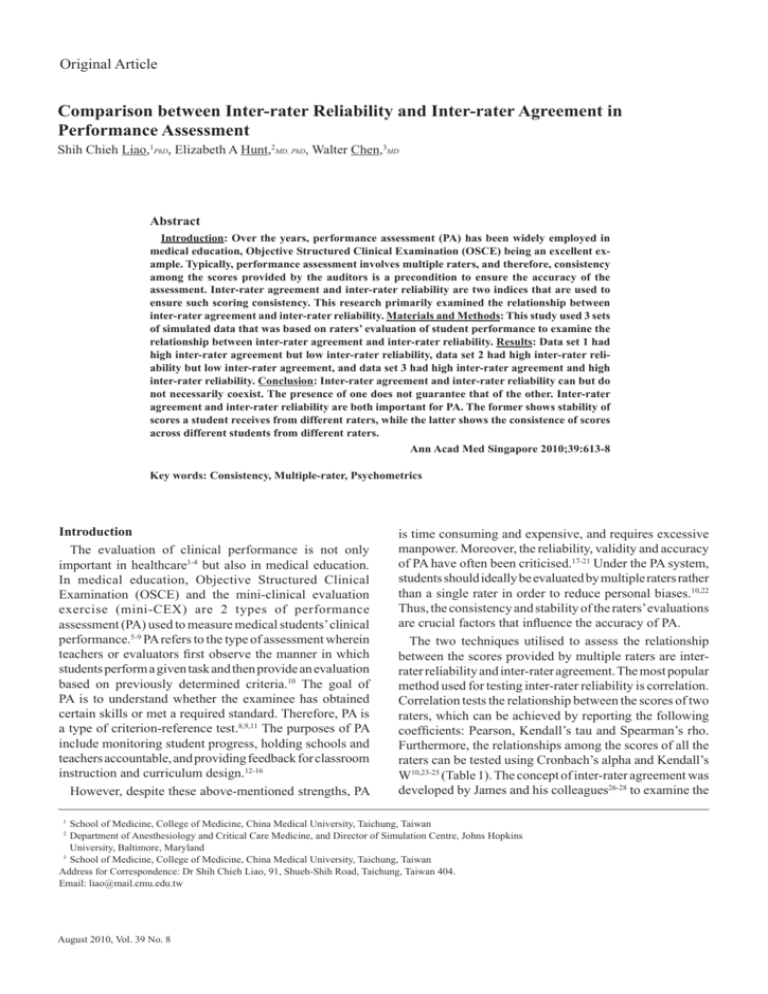
Inter-rater Reliability and Agreement–Shih Chieh Liao et al Original Article 613 Comparison between Inter-rater Reliability and Inter-rater Agreement in Performance Assessment Shih Chieh Liao,1PhD, Elizabeth A Hunt,2MD, PhD, Walter Chen,3MD Abstract Introduction: Over the years, performance assessment (PA) has been widely employed in medical education, Objective Structured Clinical Examination (OSCE) being an excellent example. Typically, performance assessment involves multiple raters, and therefore, consistency among the scores provided by the auditors is a precondition to ensure the accuracy of the assessment. Inter-rater agreement and inter-rater reliability are two indices that are used to ensure such scoring consistency. This research primarily examined the relationship between inter-rater agreement and inter-rater reliability. Materials and Methods: This study used 3 sets of simulated data that was based on raters’ evaluation of student performance to examine the relationship between inter-rater agreement and inter-rater reliability. Results: Data set 1 had high inter-rater agreement but low inter-rater reliability, data set 2 had high inter-rater reliability but low inter-rater agreement, and data set 3 had high inter-rater agreement and high inter-rater reliability. Conclusion: Inter-rater agreement and inter-rater reliability can but do not necessarily coexist. The presence of one does not guarantee that of the other. Inter-rater agreement and inter-rater reliability are both important for PA. The former shows stability of scores a student receives from different raters, while the latter shows the consistence of scores across different students from different raters. Ann Acad Med Singapore 2010;39:613-8 Key words: Consistency, Multiple-rater, Psychometrics Introduction The evaluation of clinical performance is not only important in healthcare1-4 but also in medical education. In medical education, Objective Structured Clinical Examination (OSCE) and the mini-clinical evaluation exercise (mini-CEX) are 2 types of performance assessment (PA) used to measure medical students’ clinical performance.5-9 PA refers to the type of assessment wherein teachers or evaluators first observe the manner in which students perform a given task and then provide an evaluation based on previously determined criteria.10 The goal of PA is to understand whether the examinee has obtained certain skills or met a required standard. Therefore, PA is a type of criterion-reference test.8,9,11 The purposes of PA include monitoring student progress, holding schools and teachers accountable, and providing feedback for classroom instruction and curriculum design.12-16 However, despite these above-mentioned strengths, PA is time consuming and expensive, and requires excessive manpower. Moreover, the reliability, validity and accuracy of PA have often been criticised.17-21 Under the PA system, students should ideally be evaluated by multiple raters rather than a single rater in order to reduce personal biases.10,22 Thus, the consistency and stability of the raters’ evaluations are crucial factors that influence the accuracy of PA. The two techniques utilised to assess the relationship between the scores provided by multiple raters are interrater reliability and inter-rater agreement. The most popular method used for testing inter-rater reliability is correlation. Correlation tests the relationship between the scores of two raters, which can be achieved by reporting the following coefficients: Pearson, Kendall’s tau and Spearman’s rho. Furthermore, the relationships among the scores of all the raters can be tested using Cronbach’s alpha and Kendall’s W10,23-25 (Table 1). The concept of inter-rater agreement was developed by James and his colleagues26-28 to examine the School of Medicine, College of Medicine, China Medical University, Taichung, Taiwan Department of Anesthesiology and Critical Care Medicine, and Director of Simulation Centre, Johns Hopkins University, Baltimore, Maryland 3 School of Medicine, College of Medicine, China Medical University, Taichung, Taiwan Address for Correspondence: Dr Shih Chieh Liao, 91, Shueh-Shih Road, Taichung, Taiwan 404. Email: liao@mail.cmu.edu.tw 1 2 August 2010, Vol. 39 No. 8 614 Inter-rater Reliability and Agreement–Shih Chieh Liao et al relationship between the scores of different raters. The term ‘total variance’ is used in both inter-rater reliability, as discussed in the classical test theory, and inter-rater agreement, as discussed by James; however, what is meant by ‘total variance’ in the two techniques differs greatly. According to the classical test theory, total variance is the sum of true variance and random measurement-error variance.10,11 Therefore, the concept of total variance in the inter-rater reliability is unrelated to raters. In this regard, James et al26-28 argued that total variance comprises two parts, namely, random measurement-error variance and systematic variance. The former is caused by random factors such as emotional fluctuations, changes in motivation, loss of attention, illness, fatigue and stress. The latter includes both true variance and variances that reflect biases among raters. Therefore, based on inter-rater agreement, total variance is related to the raters. Furthermore, the evaluation indices for inter-rater reliability and inter-rater agreement are different. The evaluation index for inter-rater reliability is based on the comparison of the score variances among different raters. On the other hand, the evaluation index for inter-rater agreement does not consider the variances among different raters. Instead, only the score variances within a student are taken into consideration in the establishment of an evaluation index. James et al26-28 suggested the following two functions for measuring single-item inter-rater agreement and parallelitems inter-rater agreement. Single-item inter-rater agreement, rWG(l) If xj is an item with k raters and the score range of xj is from 1 to m, then the inter-rater agreement of xj, rWG(l), is as follows: rWG(l) = 1 – (Sx2j θ2EU ) (1) where Sx2j denotes the observed variance on xj, and θ = (S2 – 1 )/12 is the variance on x j that would be anticipated if all judgments result from random measurement-error only. 2 EU Parallel-items inter-rater agreement, rWG(J) For J parallel-items, each item is judged by the same k raters, and the score range of each item is from 1 to m. Thus, the inter-rater agreement of these J parallel-items, rWG(J) , is rWG(J) = 2 J[1– ( Sx2j / θEU )] 2 2 J[1– ( Sx2j / θEU )] + ( Sx2j / θEU ) (2) Table 1. The Method, Function and Applications of Inter-rater Reliability and Agreement Inter-rater Reliability­ Method­ Two-Raters­ n Pearson product moment­ r = Σ(xi – x)(yi – y) (n – 1)sxsy , where x and y are the sample means of X and Y , sx and sy are the sample standard deviations of i=1 X and Y ­ Kendall’s tau­ τ = [4P /n(n – 1)] – 1 , where n is the number of items, and P is the sum, over all the items, of items ranked after the given item by both rankings.­ n Spearman’s rho­ ρ = 1 – [6 Σd2i n(n2 – 1)] , where di = the difference between each rank of corresponding values of x and y, and n = the number of pairs of i=1 values.­ More than Two Raters­ I I [1 – ( ΣS2i S2 )] , where I is the number of items, S means the total standard deviation, and Si is the standard deviation I–1 i=1 of i item, for 1 < i < I.­ Cronbach alpha­ α = Kendall’s W W = 12 k Σ R2i – 3k2 N(N + 1)2 i=1 k2 (k3 – N) , where k means the number of raters, Ri means the sum of i rater score, and N means the total number of students.­ Inter-rater Agreement­ 2 Single-item inter-rater agreement­ rWG(l) = 1 – ( S2x / θ2 ) , where S2xj is the observed variance on Xj, andis θEU the variance on Xj that would be expected j EU if all judgments were due exclusively to random measurement error.­ within-group inter-rater reliability­ rWG(J) =J[1– (S2xj / θEU2 ) ] J[1– ( S2xj / θ2 ) ] + ( S2xj / θEU2) , where S2xj is the mean of the observed variances on the J items, and θ2 has the same definition as before. EU EU Annals Academy of Medicine Inter-rater Reliability and Agreement–Shih Chieh Liao et al 2 where Sx2j and θEU denote the mean of the observed variances on J items and the variance on xj that would be anticipated if all judgments result from random measurement-error only, respectively. The primary objective of this research is to examine the relationships between inter-rater reliability and inter-rater agreement based on 3 sets of simulated data. Furthermore, the interaction between these 2 techniques has also been explored. Finally, their impact on PA has been discussed. Materials and Methods The 3 sets of simulated data used for comparing interrater reliability and inter-rater agreement were 3 raters’ evaluation of 10 students’ performance. They were derived from equations for inter-rater reliability and inter-rater agreement. The simulated data was created by the authors’ experience in conducting PA. Each set of data contained the evaluation of three raters on the performance of 10 students. Furthermore, the scores were given on a scale of 1 to 9, wherein 1 to 3 signified unsatisfactory, 4 to 6 denoted satisfactory, and 7 to 9 indicated superior performance (Tables 2, 3, 4). The following correlation coefficients were used with respect to inter-rater reliability: Pearson product moment, Kendall’s tau, Spearman’s rho, Cronbach’s alpha and Kendall’s W. With regard to inter-rater agreement, singleitem inter-rater agreement and within-group inter-rater reliability were used. In addition, inter-rater reliability was calculated using SPSS statistical software (version 15.0 615 for Windows, SPSS Inc, Chicago, Illinois) and inter-rater agreement was estimated using Mathematica (version 6.0, Wolfram Research Inc, Chicago, Illinois). Results Based on the results of the analyses, data set 1 indicated high inter-rater agreement but low inter-rater reliability. On the other hand, data set 2 demonstrated high inter-rater reliability but low inter-rater agreement. Finally, data set 3 showed high inter-rater reliability and inter-rater agreement (Tables 2, 3, 4). In data set 1 (Table 2), the means and standard deviations of the scores of the 3 raters, J1, J2 and J3, were 6.000 (1.054), 6.000 (1.054), 5.800 (1.033), respectively. The mean scores of the 10 students were either 5.667 (1.155), S1, S2, S5, S6, S8 and S10, or 6.333 (1.155), others. Thus, based on the results presented in Table 2, it can be concluded that there was only a small variation in the scores within a student, across all students. With regard to inter-rater agreement, in data set 1, all single-item agreements, rWG(l), were 0.800. With respect to inter-rater reliability, these ranged from –1.000 to 0.000. Furthermore, Cronbach’s alpha was –3.125 and Kendall’s W was 0.010 (P = 0.905). Thus, as shown in Table 2, it is evident that data set 1 had high inter-rater agreement but low inter-rater reliability. Let us now consider Table 3 that presents analyses based on data set 2. Here, the means and standard deviations of the scores of 3 raters, J1, J2 and J3, were 3.400 (1.713), 4.200 (2.936) and 7.400 (1.713), respectively. In addition, Table 2. Simulated Data 1 with High Inter-rater Agreement but Low Inter-rater Reliability ­ S1­ S2­ S3­ S4­ S5­ S6­ S7­ S8­ S9­ S10­ M­ SD­ J1­ 5­ 5­ 5­ 5­ 5­ 7­ 7­ 7­ 7­ 7­ 6.000­ 1.054­ J2­ 7­ 7­ 7­ 7­ 7­ 5­ 5­ 5­ 5­ 5­ 6.000­ 1.054­ J3­ 5­ 5­ 7­ 7­ 5­ 5­ 7­ 5­ 7­ 5­ 5.800­ 1.033­ M­ 5.667­ 5.667­ 6.333­ 6.333­ 5.667­ 5.667­ 6.333­ 5.667­ 6.333­ 5.667­ N/A­ N/A­ SD­ 1.155­ 1.155­ 1.155­ 1.155­ 1.155­ 1.155­ 1.155­ 1.155­ 1.155­ 1.155­ N/A­ N/A­ Inter-rater Agreement §­ 2 ­S xj 1.333­ 1.333­ 1.333­ 1.333­ 1.333­ 1.333­ 1.333­ 1.333­ 1.333­ 1.333­ 1.333­ N/A­ rWG(l)­ 0.800­ 0.800­ 0.800­ 0.800­ 0.800­ 0.800­ 0.800­ 0.800­ 0.800­ 0.800­ N/A­ N/A­ Inter-rater Reliability*­ Pearson­ Kendall’s tau­ Spearman’s rho­ J1 vs J2­ -1.000†­ -1.000†­ -1.000†­ J1 vs J3­ 0.000­ 0.000­ 0.000­ J2 vs J3­ 0.000­ 0.000­ 0.000­ § All of θ2 is 6.667. EU * Cronbach’s alpha was -3.125 and Kendall’s W was 0.010 (P = 0.905). The value of Cronbach’s alpha was negative due to a negative average covariance among items. This violates reliability model assumptions. † Correlation is significant at the 0.01 level (2-tailed). August 2010, Vol. 39 No. 8 616 Inter-rater Reliability and Agreement–Shih Chieh Liao et al Table 3. Simulated Data 2 with High Inter-rater Reliability but Low Inter-rater Agreement ­ S1­ S2­ S3­ S4­ S5­ S6­ S7­ S8­ S9­ S10­ M­ SD­ J1­ 1­ 1­ 2­ 2­ 4­ 4­ 5­ 5­ 5­ 5­ 3.400­ 1.713­ J2­ 1­ 1­ 2­ 2­ 4­ 4­ 5­ 5­ 9­ 9­ 4.200­ 2.936­ J3­ 5­ 5­ 6­ 6­ 8­ 8­ 9­ 9­ 9­ 9­ 7.400­ 1.713­ M­ 2.333­ 2.333­ 3.333­ 3.333­ 5.333­ 5.333­ 6.333­ 6.333­ 7.667­ 7.667­ 5.333­ N/A­ SD­ 2.309­ 2.309­ 2.309­ 2.309­ 2.309­ 2.309­ 2.309­ 2.309­ 2.309­ 2.309­ N/A­ N/A­ Inter-rater Agreement ­ § ­S2xj 5.333­ 5.333­ 5.333­ 5.333­ 5.333­ 5.333­ 5.333­ 5.333­ 5.333­ 5.333­ 5.333­ N/A­ ­rWG(l) 0.200­ 0.200­ 0.200­ 0.200­ 0.200­ 0.200­ 0.200­ 0.200­ 0.200­ 0.200­ N/A­ N/A­ Inter-rater Reliability*­ ­ Pearson­ Kendall’s tau­ Spearman’s rho­ J1 vs J2­ 0.866†­ 0.949† 0.975†­ J1 vs J3­ 1.000†­ 1.000†­ 1.000†­ J2 vs J3­ 0.866†­ 0.949†­ 0.975† § All of θ2 is 6.667. EU * Cronbach’s alpha was 0.925 and Kendall’s W was 0.840 (P <0.001). † Correlation is significant at the 0.01 level (2-tailed). Table 4. Simulated Data 3 with High Inter-rater Agreement and High Inter-rater Reliability S1­ S2­ S3­ S4­ S5­ S6­ S7­ S8­ S9­ S10­ M­ SD­ J1­ 1­ 2­ 3­ 4­ 5­ 5­ 5­ 7­ 8­ 8­ 4.800­ 2.394­ J2­ 2­ 2­ 3­ 5­ 5­ 6­ 6­ 8­ 8­ 9­ 5.400­ 2.503­ J3­ 3­ 3­ 4­ 6­ 6­ 6­ 7­ 9­ 9­ 9­ 6.200­ 2.348­ M­ 2.000­ 2.333­ 3.333­ 5.000­ 5.333­ 5.667­ 6.000­ 8.000­ 8.333­ 8.667­ N/A­ N/A­ SD­ 1.000­ 0.577­ 0.577­ 1.000­ 0.577­ 0.577­ 1.000­ 1.000­ 0.577­ 0.577­ 1.155­ N/A­ Inter-rater Agreement§­ ­S2xj 1.000­ 0.333­ 0.333­ 1.000­ 0.333­ 0.333­ 1.000­ 1.000­ 0.333­ 0.333­ 0.600­ N/A­ ­rWG(l) 0.850­ 0.950­ 0.950­ 0.850­ 0.950­ 0.950­ 0.850­ 0.850­ 0.950­ 0.950­ N/A­ N/A­ Inter-rater Reliability*­ Pearson­ Kendall’s tau­ Spearman’s rho­ J1 vs J2­ 0.979†­ 0.927†­ 0.969†­ J1 vs J3­ 0.976† 0.912†­ 0.962†­ 0.987† 0.937†­ 0.972†­ J2 vs J3­ All of θ is 6.667. * Cronbach’s alpha was 0.993 and Kendall’s W was 0.859 (P <0.001). † Correlation is significant at the 0.01 level (2-tailed). § 2 EU the means and standard deviations of the students’ scores ranged from 2.333 (2.309), S1 and S2, to 7.667 (2.309), S9 and S10. Thus, as can be seen in Table 3, unlike Table 2, there was a considerable variance in the scores within a student, across all students. Moreover, with regard to inter-rater agreement, all single-item agreements, rWG(l), were 0.200. For inter-rater reliability, these ranged from 0.866 to 1.000. Cronbach’s alpha was 0.925 and Kendall’s W was 0.840 (P <0.001). Therefore, based on Table 3, we can conclude that data set 2 had high inter-rater reliability but low inter-rater agreement. Analyses based on data set 3 are presented in Table 4. As shown, the means and standard deviations of the 3 raters’ scores, J1, J2 and J3, were 4.800 (2.394), 5.400 (2.503) Annals Academy of Medicine Inter-rater Reliability and Agreement–Shih Chieh Liao et al and 6.200 (2.348), respectively. The means of the scores of the 10 students ranged from 2.000 (1.000), S1, to 8.667 (0.577), S10. Thus, there was only a small variation in the scores within a student, across all students. For inter-rater agreement, all the single-item agreements, rWG(l), ranged from 0.850 to 0.950. For inter-rater reliability, these ranged form 0.912 to 0.987. Additionally, Cronbach’s alpha was 0.993 and Kendall’s W was 0.859 (P <0.001). Hence, Table 4 clearly indicates that data set 3 had high inter-rater reliability and high inter-rater agreement. Discussion Based on 3 sets of simulated data, we discussed the relationships between inter-rater agreement and interrater reliability. Inter-rater agreement is equivalent to the stability of scores from different raters to each student. In data set 1, scores of each student fall across two different performance categories, but the difference in the three scores of each student is always 2 (Table 2). However, in data set 2, although scores of each student also fall across two different performance categories, the difference in the three scores of each student is always 4 (Table 3). This shows that in data set 1, scores from different raters to each student are more stable than those in data set 2. In data set 1 where the difference in scores within a student is 2, the observed variance, S2xj , is 1.333; in data set 2 where the difference in scores within a student is 4, 2 the observed variance, S xj, is 5.333. In data set 2 where the difference in scores within a student is larger (4 vs 2), the observed variance, S2xj , is also larger. Based on equations 1 and 2, for a fixed number of items and score scale, observed variance is the only factor that determines both single-item agreement and parallel-items agreement. As the observance variance increases, the smaller the single-item agreement and parallel-items agreement decrease. Therefore, it can be concluded that the stability of scores within each student is positively related to inter-rater agreement. Inter-rater reliability is equivalent to the consistency of scores from different raters across all students. It is based on correlation tests like Pearson, Kendall’s tau, and Spearman’s rho, and reliability tests like Cronbach’s alpha and Kendall’s W10,23-25 (Table 1). These correlation and reliability tests examine the consistency of scores from different raters to the same student. That is, they check whether a highscoring student receives high scores from all raters and a low-scoring student receives low scores from all raters. If so, the inter-rater reliability would be high. In data set 2, although the difference in scores within each student is 4, high-scoring students receive higher scores from all raters and low-scoring students receive lower scores from all raters. The difference in scores within each student is high because there exists a severity effect – rater August 2010, Vol. 39 No. 8 617 3. It is not uncommon to have raters who hold different evaluation standards.29,30 In contrast to data 2, in data set 1, although there was a better stability in scores from the 3 raters within each student (i.e., 2), there was a larger variation between the scores given by raters 1 and 2 across the 10 students (Table 2). For instance, S1, S2, S3, S4, and S5 received 5 points (satisfactory category) from rater 1, but 7 points (superior category) from rater 2. On the other hand, S6, S7, S8, S9, and S10 received 7 points from rater 1 but 5 points from rater 2 (Table 2). Although all the scores of the 10 students fall in the categories of satisfactory and superior, the scores given by raters 1 and 2 were at the two opposite extremes. Therefore, it can be concluded that the inter-rater reliability in data set 1 is low. Could inter-rater agreement and inter-rater reliability coexist? They do, as shown in data set 3 (Table 4). In data set 3, the single-item agreement ranged from 0.850 to 0.950. The single-item agreement for data set 1 was a constant 0.800. This means data set 3 has a better inter-rater agreement than data set 1. For inter-rater reliability, data set 3 ranged from 0.912 to 0.987, Cronbach’s alpha was 0.993 and Kendall’s W was 0.859 (P <0.001). In data 2, inter-rater reliability ranged from 0.866 to 1.000, Cronbach’s alpha was 0.925, and Kendall’s W was 0.840 (P <0.001) This means that like data set 2, data set 3 also has a good inter-rater reliability. Conclusion While inter-rater reliability and inter-rater agreement can coexist in the scores of the raters in PA, we conclude that the presence of one does not guarantee the presence of the other, as seen in data sets 1 and 2. Data set 2 had good inter-rater reliability but low agreement, and data set 1 had high inter-rater agreement but low reliability. In data set 3, the inter-rater reliability was as high as that in data set 2, and the agreement was as high as that in data set 1. Both inter-rater reliability and inter-rater agreement are important with respect to raters’ scores in PA. Our analyses show that a PA with inter-rater reliability means the rater’s scores are consistent across different students and a PA with inter-rater agreement means the scores from different raters within a student are stable, which suggests that the assessment can clearly reveal student ability. PA is a type of criterion-reference test.8,9,11 The purpose of PA is not to compare students’ performance but to understand each student’s ability or whether they have met a certain standard. PA helps educators to monitor student progress, to hold schools and teachers accountable, and to provide feedback for classroom instruction and curriculum design.12-16 Students’ individual differences are recognised in PA, and it is not a major concern in PA to compare and 618 Inter-rater Reliability and Agreement–Shih Chieh Liao et al contrast between different students. When there is a good inter-rater agreement in PA, it means there is a clear indication of the student’s ability. A high inter-rater agreement helps both instructors and students to see the student’s learning outcome. A PA could be even more effective if inter-rater reliability is also strengthened. Inter-rater reliability could be raised, if raters are appropriately trained.16,31 For potential implication of PA, we suggest that a rater training course be held first and a pilot study be conducted before the main study. The purpose of the pilot study would be to understand inter-rater reliability and agreement and provide suggestions for training the raters. Only when both inter-rater reliability and inter-rater agreement are reached can a PA serve its purpose. Acknowledgements The authors appreciate the financial support provided by the China Medical University Hospital (CMUH-EDU9711E) for the purpose of this research. Furthermore, the authors would like to thank Dr Craig Bowen for his valuable suggestions and comments and Betty Pei Chun Huang for her help with the revisions made to this manuscript. 10. Nitko AJ. Educational assessment of students, 4th ed. Upper Saddle River: Pearson, 2004. 11. Hopkins KD. Educational and Psychological Measurement and Evaluation, 8th ed. Needham Heights: Pearson, 1998. 12. Kane MB, Khattri N, Reeve AL, Adamson RJ. Assessment of student performance. Washington DC: Studies of Education Reform, Office of Educational Research and Improvement, US Department of Education, 1997. 13. Messick S. Validity of performance assessment. In: Phillips G, editor. Technical issues in large-scale performance assessment. Washington, DC: National Center for Educational Statistics, 1996. 14. Black P. Testing: Friend or foe? London: Falmer Press, 1998. 15. Darling-Hammond L, Snyder J. Authentic assessment of teaching in context. Teaching and Teacher Educ 2000;16:523-45. 16. Jonsson A, Svingby G. The use of scoring rubrics: Reliability, validity and educational consequences. Educ Res Rev 2007;2:130-44. 17. Spady WG. Competency based education: A bandwagon in search of a definition. Educ Res 1977;6:9-14. 18. Burger SE, Burger DL. Determining the validity of performance-based assessment. Educ Meas: Issues and Practice 1994;31:9-15. 19. Youngs P, Odden A, Porter AC. State policy related to teacher licensure. Educ Pol 2003;17:217-36. 20. Pecheone RL, Pigg MJ, Chung RR, Souviney RJ. Performance assessment and electronic portfolios: Their effect on teacher learning and education. Clearing House 2005;78:164-76. 21. Lichtenberg JW, Portnoy SM, Bebeau MJ, Leigh IW, Nelson PD, Rubin NJ, et al. Challenges to the assessment of competence and competencies. Prof Psychol Res Pr 2007;38:474-8. REFERENCES 1. Blumenthal D. The role of physicians in the future of quality management. N Engl J Med 1996;335:1328-31. 2. Brook RH, McGlynn EA, Cleary PO. Measuring quality of care. N Engl J Med 1996;335:966-70. 3. Casalino LP. The universal consequences of measuring the quality of medical care. N Engl J Med 1999;341:1147-50. 4. Jencks MD, Stephen F. Clinical performance measurement—a hard sell. JAMA 2000;283:2015-6. 5. Southgate L, Dauphinee D. Maintaining standards in British and Canadian medicine: the developing role of the regulatory body. BMJ 1998;319:697700. 6. Southgate L, Pringle M. Revalidation in the United Kingdom: general principles based on experience in general practice. BMJ 1999;319:1180-3. 7. Jolly B, McAvoy P, Southgate L. GMC’s proposals for revalidation. Effective revalidation system looks at how doctors practise and quality of patients’ experience. BMJ 2001;322:358-9. 8. Southgate L, Hays R, Norcini J, Mulholland H, Ayers B, Woolliscroft J, et al. Setting performance standards for medical practice: a theoretical framework. Med Educ 2001;35:474-81. 9. Turner J, Dankoski M. Objective Structured Clinical Exams: A Critical Review. J Fam Med 2008;40:574-8. 22. Wass V, van der Vleuten C, Shatzer J, Jones R. Assessment of clinical competence. Lancet 2001;357:945-9. 23. Dielman TE. Psychometric properties of clinical performance ratings. Eval Health Prof 1980;3:103-17. 24. Hutchinson L, Aitken P, Hayes T. Are medical postgraduate certification processes valid? A systematic review of the published evidence. Med Educ 2002;36:73-91. 25. Lynch DC, Surdyk PM, Eiser AR. Assessing professionalism: A review of the literature. Med Teach 2004;26:366-73. 26. James LR. Aggregation bias in estimates of perceptual agreement. J Appl Psychol 1982;67:219-29. 27. James LR, Demaree RG, Wolf G. Estimating within-group inter-rater reliability with and without response bias. J Appl Psychol 1984;69:85-98. 28. James LR, Demaree RG, Wolf G. Rwg: An assessment of within-group inter-rater agreement. J Appl Psychol 1993;78:306-9. 29. Hoyt WT. Rater bias in psychological research: When is it a problem and what can we do about it? Psychol Meth 2000;5:64-86. 30. Myford CM, Wolfe EW. Detecting and measuring rater effects using many-facet Rasch measurement: Part I. J of Appl Meas 2003;4:386-422. 31. Weigle SC. Investigating rater/prompt interactions in writing assessment: Quantitative and qualitative approaches. Assessing Writing 1999;6:145-78. Annals Academy of Medicine
