Name AP Biology AP Lab 12--DISSOLVED OXYGEN & AQUATIC
advertisement
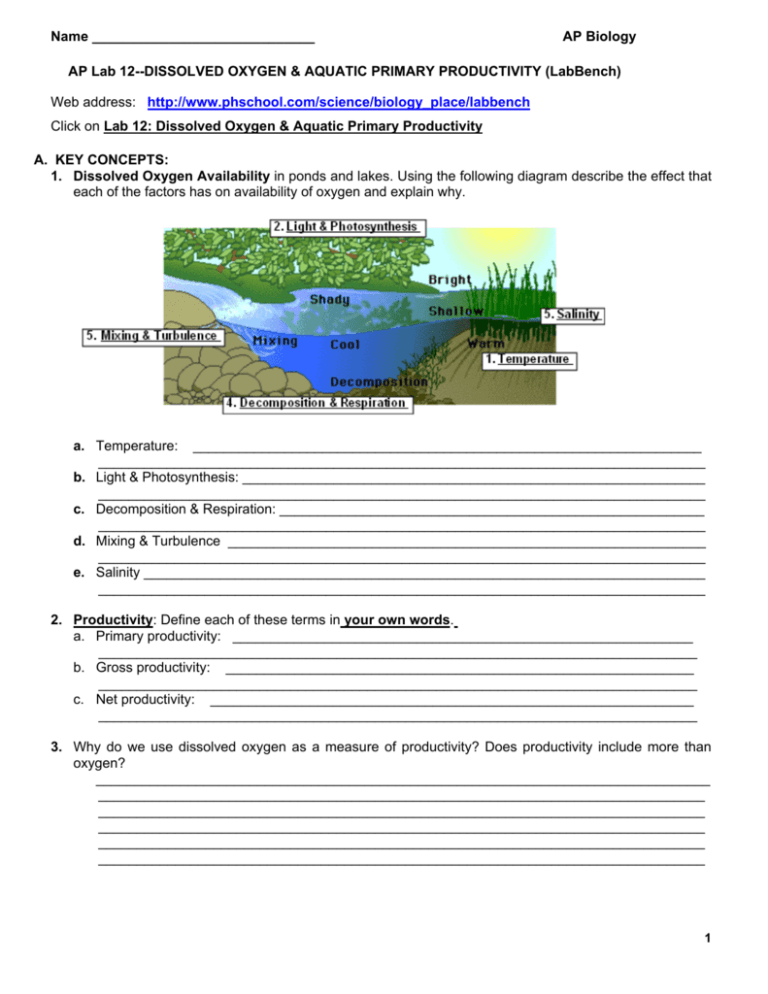
Name _____________________________ AP Biology AP Lab 12--DISSOLVED OXYGEN & AQUATIC PRIMARY PRODUCTIVITY (LabBench) Web address: http://www.phschool.com/science/biology_place/labbench Click on Lab 12: Dissolved Oxygen & Aquatic Primary Productivity A. KEY CONCEPTS: 1. Dissolved Oxygen Availability in ponds and lakes. Using the following diagram describe the effect that each of the factors has on availability of oxygen and explain why. a. Temperature: ___________________________________________________________________ ________________________________________________________________________________ b. Light & Photosynthesis: _____________________________________________________________ ________________________________________________________________________________ c. Decomposition & Respiration: ________________________________________________________ ________________________________________________________________________________ d. Mixing & Turbulence _______________________________________________________________ ________________________________________________________________________________ e. Salinity __________________________________________________________________________ ________________________________________________________________________________ 2. Productivity: Define each of these terms in your own words. a. Primary productivity: ____________________________________________________________ ______________________________________________________________________________ b. Gross productivity: _____________________________________________________________ ______________________________________________________________________________ c. Net productivity: _______________________________________________________________ ______________________________________________________________________________ 3. Why do we use dissolved oxygen as a measure of productivity? Does productivity include more than oxygen? ________________________________________________________________________________ _______________________________________________________________________________ _______________________________________________________________________________ _______________________________________________________________________________ _______________________________________________________________________________ _______________________________________________________________________________ 1 4. Using the diagrams below explain: a. How does putting a sample of pond water and algae/freshwater plants in the light enable us to measure gross productivity? ________________________________________________ _________________________________________________________________________ b. How does putting a sample of pond water and algae/freshwater plants in the dark enable us to measure respiration? ______________________________________________________ _________________________________________________________________________ c. How does subtracting the two enable us to indirectly measure net productivity? __________________________________________________________________________ __________________________________________________________________________ 5. What are the three ways that primary productivity can be measured? Highlight the way will be used in this lab?. a. _________________________________________________________________________ _________________________________________________________________________ b. _________________________________________________________________________ _________________________________________________________________________ c. _________________________________________________________________________ _________________________________________________________________________ B. LAB PART 1: EFFECT OF TEMPERATURE ON DISSOLVED OXYGEN We actually did this part of the lab already. Remind yourself of our experiment, our procedures, and our conclusions. We were investigating the effect of the physical factor of temperature on the percent dissolved oxygen in a body of water. 6. What is the relationship between water temperature and dissolved oxygen? _________________________________________________________________________ _________________________________________________________________________ _________________________________________________________________________ 7. Explain why this relationship exists. _________________________________________________________________________ _________________________________________________________________________ _________________________________________________________________________ 8. So, now explain why the fish in the aquarium (on the LabBench Web site) above the radiator died? _________________________________________________________________________ _________________________________________________________________________ _________________________________________________________________________ 2 C. A MODEL OF PRODUCTIVITY AS A FUNCTION OF DEPTH IN A LAKE Now we are going to look at the biological factors that affect dissolved oxygen in a body of water. Look at the experimental design on the LabBench Web site (http://www.phschool.com/science/biology_place/labbench/lab12/model.html). We are taking a sample of pond water (with algae) and then modeling different depths in the pond by using screening to block out successive amounts of light. One hundred percent light for shallow depth, all the way to 0% light for deep ponds. 9. Why do we take an initial reading of dissolved oxygen? What purpose does this serve in the experiment? _________________________________________________________________________ _________________________________________________________________________ _________________________________________________________________________ 10. Click on the “closer look” magnifying glass on the “initial bottle”. Why does the animation show oxygen being diffusing out of the freshwater plants? What does this signify? _________________________________________________________________________ _________________________________________________________________________ _________________________________________________________________________ 11. Click on the “closer look” magnifying glass on the foil- covered bottle. Why does the animation show oxygen diffusing into the freshwater plants? What does this signify? ________________________________________________________________________ ________________________________________________________________________ ________________________________________________________________________ 12. Click on the “closer look” magnifying glass on the 100% bottle under the light. Why does the animation show oxygen diffusing both into and out of the freshwater plants? What does this signify? _________________________________________________________________________ _________________________________________________________________________ _________________________________________________________________________ D. ANALYSIS OF RESULTS Let’s look at the results that will allow you to calculate the different types of productivity. 13. Measuring Respiration: Remember that plants (producers) perform both photosynthesis and respiration. To measure the amount of respiration that is happening in the bottle, we measure the amount of dissolved oxygen in the initial sample and then the amount of oxygen in the bottle kept in the dark. As shown in the illustration below, you then subtract the amount of dissolved oxygen in the “dark bottle” from the amount of dissolved oxygen in the “initial bottle” to calculate the amount of oxygen consumed in respiration. I have added some possible measurements to help. Explain why this calculation works. _________________________________________________________________________ _________________________________________________________________________ _________________________________________________________________________ 3 14. Measuring Gross Productivity: Remember gross productivity is the total amount of sugars and oxygen produced by the plants in an ecosystem. I don’t like how this Web site shows you how to calculate gross productivity. The equation is correct, but it is a short cut, so it makes it more difficult to understand. So follow me with the illustrations and the possible measurements below. So the illustration shows us there was 10mg increase in dissolved oxygen in the jar as a result of photosynthesis in the last 24 hours and there was 5mg decrease in dissolved oxygen in the jar as a result of respiration in the last 24 hours. So the gross productivity (the full photosynthetic production in this ecosystem) of the algae in the bottle is the 5mg dissolved oxygen lost to respiration added back to the 10 mg dissolved oxygen accumulated in the bottle kept in the light. So what the algae really produced in the bottle was a total of 15mg dissolved oxygen, it just lost 5mg to respiration. And remember, the oxygen is an indirect measurement of the sugars produced in photosynthesis and lost in respiration. 10 mg oxygen gained 5 mg oxygen lost + 15 mg oxygen as = from photosynthesis to respiration gross productivity Now, in your own words, explain why this calculation works. _________________________________________________________________________ _________________________________________________________________________ _________________________________________________________________________ 15. Measuring Net Productivity: Remember net productivity is the amount of sugars and dissolved oxygen produced by the plants in an ecosystem once you subtract out what the producers have consumed in respiration. So we actually already calculated that in the last example; I just called it “net photosynthesis.” Explain why this calculation works. _________________________________________________________________________ _________________________________________________________________________ _________________________________________________________________________ 4 16. Print out the completed calculation table from Sample Problem page of the LabBench Web site, fill in your predictions on the graph as well, and attach it to this lab to show me that you have completed it. 17. Print out the Lab Quiz and attach it to this lab to show me that you completed it. SUMMARY QUESTIONS 18. Would you expect the dissolved oxygen levels in water sampled from a stream entering a lake to be higher or lower than the dissolved oxygen levels in water sampled from the lake itself? Explain. _____________________________________________________________________________ _____________________________________________________________________________ _____________________________________________________________________________ _____________________________________________________________________________ 19. Would you expect the dissolved oxygen levels in water sampled from a lake at 7AM to be higher or lower than the dissolved oxygen levels in water sampled at 5PM? Explain. _____________________________________________________________________________ _____________________________________________________________________________ _____________________________________________________________________________ _____________________________________________________________________________ 20. One of the major sources of water pollution is the runoff from fertilizer used in agriculture and on suburban lawns as well as golf courses. In particular, the nitrogen and phosphorus nutrients in the fertilizer creates problems in the streams and ponds it flows into. They cause algal blooms and eutrophication in lakes. a. Why do nitrogen and phosphorus promote a lot of plant/algal growth? _____________________________________________________________________________ _____________________________________________________________________________ _____________________________________________________________________________ _____________________________________________________________________________ b. What is meant by algal bloom? (Look it up!) _____________________________________________________________________________ _____________________________________________________________________________ _____________________________________________________________________________ _____________________________________________________________________________ c. What problems do algal blooms cause in ponds & lakes? Why isn’t a lot more producers a good thing? (Look it up!) _____________________________________________________________________________ _____________________________________________________________________________ _____________________________________________________________________________ _____________________________________________________________________________ d. What is meant by eutrophication? (Look it up!) _____________________________________________________________________________ _____________________________________________________________________________ _____________________________________________________________________________ 21. At what depth—shallow or deep—will there be more primary productivity in a pond or a lake? Explain. _____________________________________________________________________________ _____________________________________________________________________________ _____________________________________________________________________________ 22. In an experiment, why do we use the mean of class data to make conclusions rather than individual student group data? _____________________________________________________________________________ _____________________________________________________________________________ _____________________________________________________________________________ _____________________________________________________________________________ 5 23. AP exam FRQ (2008). Consumers in aquatic ecosystems depend on producers for nutrition. a. Explain the difference between gross and net primary productivity. _____________________________________________________________________________ _____________________________________________________________________________ _____________________________________________________________________________ _____________________________________________________________________________ b. Describe a method to determine net and gross primary productivity in a freshwater pond over a 24hour period. _____________________________________________________________________________ _____________________________________________________________________________ _____________________________________________________________________________ _____________________________________________________________________________ c. In an experiment, net primary productivity was measured, in the early spring, for water samples taken from different depths of a freshwater pond in a temperate deciduous forest. Explain the data presented by the graph, including a description of the relative rates of metabolic processes occurring at different depths of the pond. ___________________________________________________________________________ ___________________________________________________________________________ ___________________________________________________________________________ ___________________________________________________________________________ d. Describe how the relationship between net primary productivity and depth would be expected to differ if new data were collected in mid-summer from the same pond. Explain your prediction. __________________________________________________________________________ __________________________________________________________________________ ___________________________________________________________________________ ___________________________________________________________________________ ___________________________________________________________________________ ___________________________________________________________________________ ___________________________________________________________________________ ___________________________________________________________________________ ___________________________________________________________________________ 6
