Interim report, 2005 - Svensk Exportkredit
advertisement
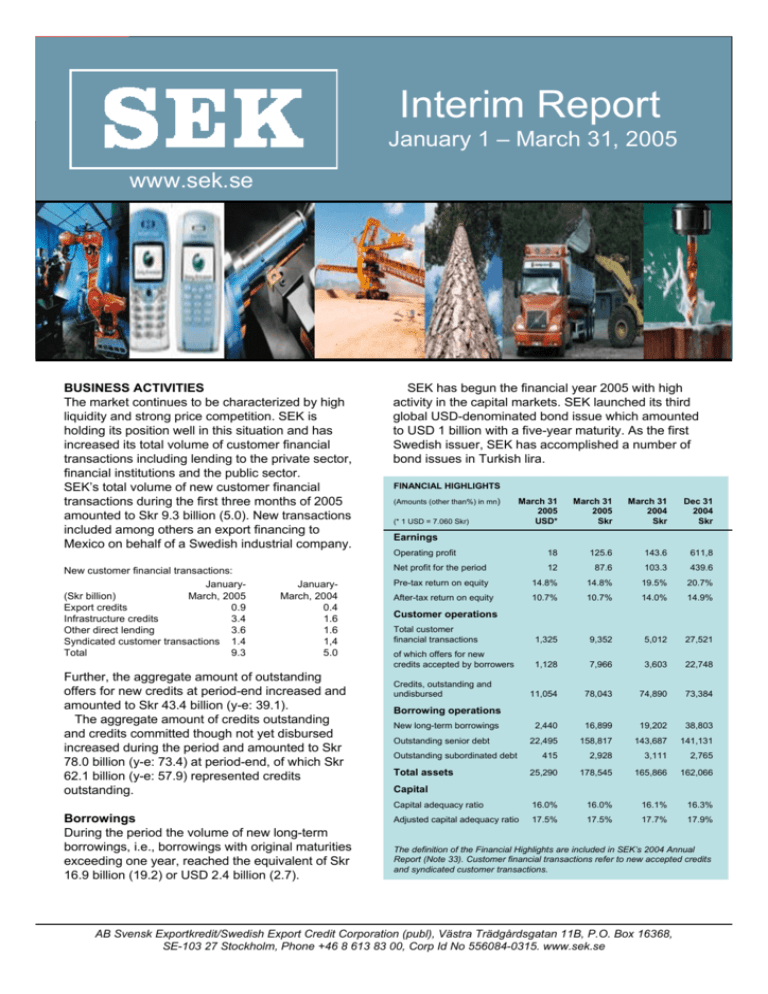
Interim Report January 1 – March 31, 2005 www.sek.se BUSINESS ACTIVITIES The market continues to be characterized by high liquidity and strong price competition. SEK is holding its position well in this situation and has increased its total volume of customer financial transactions including lending to the private sector, financial institutions and the public sector. SEK’s total volume of new customer financial transactions during the first three months of 2005 amounted to Skr 9.3 billion (5.0). New transactions included among others an export financing to Mexico on behalf of a Swedish industrial company. SEK has begun the financial year 2005 with high activity in the capital markets. SEK launched its third global USD-denominated bond issue which amounted to USD 1 billion with a five-year maturity. As the first Swedish issuer, SEK has accomplished a number of bond issues in Turkish lira. New customer financial transactions: January(Skr billion) March, 2005 Export credits 0.9 Infrastructure credits 3.4 Other direct lending 3.6 Syndicated customer transactions 1.4 Total 9.3 JanuaryMarch, 2004 0.4 1.6 1.6 1,4 5.0 Further, the aggregate amount of outstanding offers for new credits at period-end increased and amounted to Skr 43.4 billion (y-e: 39.1). The aggregate amount of credits outstanding and credits committed though not yet disbursed increased during the period and amounted to Skr 78.0 billion (y-e: 73.4) at period-end, of which Skr 62.1 billion (y-e: 57.9) represented credits outstanding. Borrowings During the period the volume of new long-term borrowings, i.e., borrowings with original maturities exceeding one year, reached the equivalent of Skr 16.9 billion (19.2) or USD 2.4 billion (2.7). FINANCIAL HIGHLIGHTS (Amounts (other than%) in mn) March 31 2005 USD* March 31 2005 Skr Operating profit 18 Net profit for the period 12 (* 1 USD = 7.060 Skr) March 31 2004 Skr Dec 31 2004 Skr 125.6 143.6 611,8 87.6 103.3 439.6 Earnings Pre-tax return on equity 14.8% 14.8% 19.5% 20.7% After-tax return on equity 10.7% 10.7% 14.0% 14.9% Total customer financial transactions 1,325 9,352 5,012 27,521 of which offers for new credits accepted by borrowers 1,128 7,966 3,603 22,748 11,054 78,043 74,890 73,384 Customer operations Credits, outstanding and undisbursed Borrowing operations New long-term borrowings Outstanding senior debt Outstanding subordinated debt Total assets 2,440 16,899 19,202 38,803 22,495 158,817 143,687 141,131 415 2,928 3,111 2,765 25,290 178,545 165,866 162,066 Capital Capital adequacy ratio 16.0% 16.0% 16.1% 16.3% Adjusted capital adequacy ratio 17.5% 17.5% 17.7% 17.9% The definition of the Financial Highlights are included in SEK’s 2004 Annual Report (Note 33). Customer financial transactions refer to new accepted credits and syndicated customer transactions. AB Svensk Exportkredit/Swedish Export Credit Corporation (publ), Västra Trädgårdsgatan 11B, P.O. Box 16368, SE-103 27 Stockholm, Phone +46 8 613 83 00, Corp Id No 556084-0315. www.sek.se INCOME STATEMENT Return on Equity Return on equity was 14.8 percent (19.5) before taxes, and 10.7 percent (14.0) after taxes, respectively. Results Operating profit was Skr 125.6 million (143.6). Net interest earnings totaled Skr 183.4 million (199.1). The decrease in net interest earnings was mainly due to decline in earnings from the investment portfolio (see below). The contribution to net interest earnings from debt-financed assets was Skr 137.2 million (129.2). The increase in net interest earnings was a result of increased average volumes of debtfinanced assets, which totaled Skr 149.1 billion (133.5), even though at somewhat lower margins. The average margin of debt-financed assets was 0.37 percent p.a. (0.39). The contribution to net interest earnings from the investment portfolio, which represents the investment of SEK's equity, was Skr 46.2 million (69.9). The decrease was due to a significant decrease in average yield in the investment portfolio where some longterm, fixed-rate assets have matured and been reinvested at significantly lower interest rates. Administrative expenses totaled to Skr 57.1 million (55.9). The increase was mainly related to costs due to new regulations within capital adequacy requirements, financial reporting, and corporate governance. Some of these costs also affected commissions incurred. Depreciations of non-financial assets increased to Skr 7.4 million (5.8). The increase was related to depreciations of intangible assets related to the replacement of SEK’s business system, which in essential part was concluded at the end of 2004. No credit losses were incurred. BALANCE SHEET Total Assets and Liquidity SEK’s total assets at year-end increased to Skr 178.5 billion (y-e: 162.1). The aggregate volume of funds borrowed and shareholders’ funds exceeded the aggregate volume of credits outstanding and credits committed though not yet disbursed at all maturities. This means that SEK has funded all its outstanding commitments through maturity. There have been no major shifts in the break-down of SEK’s counterparty risk exposures. Of the total risk exposures, 71 percent (y-e: 70) were against banks, mortgage institutions and other financial institutions; 14 percent (y-e: 15) were against highly rated OECD states; 9 percent (y-e: 9) were against corporations; and 6 percent (y-e: 6) were against local and regional authorities. Capital Adequacy SEK has a capital adequacy ratio well above the minimum required by law. At year-end, SEK’s adjusted total capital adequacy ratio was 17.5 percent (y-e: 17.9), of which 11.4 percent (y-e: 11.9) represented adjusted Tier-1. The adjusted capital adequacy ratios are calculated with inclusion in the Tier-1 capital base of SEK’s guarantee capital of Skr 600 million in addition to the regulatory capital base. The regulatory total capital adequacy ratio (which does not take into account the guarantee capital) was at period-end 16.0 percent (y-e: 16.3), of which 9.9 percent (y-e: 10.2) represented Tier-1. SEK is wholly-owned by the Kingdom of Sweden. SEK’s objective is to engage in financing activities and in connection therewith primarily promote the development of Swedish commerce and industry and Swedish export industry as well as otherwise engaging in Swedish and international financing activities on commercial grounds. Credits are granted at fixed or floating interest rates. SEK funds its activities primarily by issues in the international capital markets. SEK’s balance sheet and assets are of high quality. SEK’s long-term debt rating is AA+ from Standard & Poor’s and Aa1 from Moody’s. 2 (7) INCOME STATEMENTS SEK (exclusive of the S-system) (Skr mn) Interest revenues . . . . . . . . . . . . . . . . . . . . . Interest expenses . . . . . . . . . . . . . . . . . . . . . . January-March, 2005 Consolidated Parent Group Company 1,393.6 1,394.4 -1,210.2 -1,210.3 January-March, 2004 Consolidated Parent Group Company 1,221.5 1,223.0 -1,022.4 -1,022.5 January-December, 2004 Consolidated Parent Group Company 5,055.4 5,058.2 -4,253.7 -4,253.9 Net interest revenues . . . . . . . . . . . . . . . . . . Commissions earned. . . . . . . . . . . . . . . . . . . . Commissions incurred. . . . . . . . . . . . . . . . . . Remuneration from the S-system . . . . . . . . . Net results of financial transactions. . . . . . . . Other operating income . . . . . . . . . . . . . . . . . Administrative expenses. . . . . . . . . . . . . . . . . Depreciations of non-financial assets. . . . . . . Other operating expenses . . . . . . . . . . . . . . . . Recovered credit loss . . . . . . . . . . . . . . . . . . . 183.4 4.4 -8.5 5.4 5.5 0.1 -57.1 -7.4 -0.2 -- 184.1 2.8 -7.9 5.4 5.5 0.5 -55.4 -6.9 0.0 -- 199.1 3.5 -4.0 4.9 1.8 0.2 -55.9 -5.8 -0.2 -- 200.5 2.1 -4.0 4.9 1.7 0.3 -56.3 -5.3 0.0 -- 801.7 15.9 -17.2 17.9 5.3 0.3 -230.3 -26.4 -0.7 45.3 804.3 6.9 -17.3 17.9 5.4 1.4 -227.4 -24.2 -0.1 45.3 Operating profit . . . . . . . . . . . . . . . . . . . . . . 125.6 128.1 143.6 143.9 611.8 612.2 Changes in untaxed reserves . . . . . . . . . . . . . n.a. 0.0 n.a. 0.0 n.a. 9.9 Taxes (Note 1) . . . . . . . . . . . . . . . . . . . . . . . . Net profit for the period . . . . . . . . . . . . . . . -38.0 87.6 -38.6 89.5 -40.3 103.3 -40.3 103.6 -172.2 439.6 -174.5 447.6 Earnings per share, Skr (Note 5). . . . . . . . . . 88 104 444 The above income statements do not include the S-system, the results of which are shown below. S-system (Skr mn) January-March, 2005 January-March, 2004 January-December, 2004 Interest revenues . . . . . . . . . . . . . . . . . . Interest expenses . . . . . . . . . . . . . . . . . 83.9 -68.2 96.3 -85.5 384.1 -350.2 Net interest expenses. . . . . . . . . . . . . 15.7 10.8 33.9 Remuneration to SEK . . . . . . . . . . . . . . Foreign exchange effects. . . . . . . . . . . . -5.4 -1.4 -4.9 0.6 -17.9 2.9 Reimbursement from the State . . . Net . . . . . . . . . . . . . . . . . . . . . . . . . . . . -8.9 0.0 -6.5 0.0 -18.9 0.0 Quaterly Breakdown of Income Statements in Summary SEK (exclusive of the S-system) January- October- July- April- March, 2005 December, 2004 September, 2004 June, 2004 1,393.6 -1,210.2 1,320.4 -1,130.5 1,255.0 -1,061.2 1,258.5 -1,039.6 Net interest revenues . . . . . . . . . . . . . 183.4 189.9 193.8 218.9 Operating revenues . . . . . . . . . . . . . . . . Operating expenses . . . . . . . . . . . . . . . . . 15.4 -73.2 51.4 -75.0 9.1 -65.2 13.8 -68.5 Operating profit . . . . . . . . . . . . . . . . . 125.6 166.3 137.7 164.2 Taxes . . . . . . . . . . . . . . . . . . . . . . . . . . . . Net profit for the period . . . . . . . . . . . -38.0 87.6 -47.1 119.2 -38.7 99.0 -46.1 118.1 Consolidated Group (Skr mn) Interest revenues . . . . . . . . . . . . . . . . . . . Interest expenses . . . . . . . . . . . . . . . . . . 3 (7) BALANCE SHEETS December 31, 2004 March 31, 2005 (Skr mn) Consolidated Parent Of which Consolidated Parent Of which Group Company S-system Group Company S-system ASSETS Cash in hand . . . . . . . . . . . . . . . . . . . . . . . . . . . . . . . 0.0 0.0 0.0 0.0 0.0 0.0 Treasuries/government bonds.. . . . . . . . . . . . . . . . . . 2,219.7 2,219.7 0.0 2,709.3 2,709.3 59.7 Of which current assets . . . . . . . . . . . . . . . . . . . . . (1,939.8) (1,939.8) 0.0 (2,436.4) (2,436.4) (59.7) Of which fixed assets . . . . . . . . . . . . . . . . . . . . . . . (279.9) (279.9) - (272.9) (272.9) - 9,875.6 9,872.9 3,182.5 12,773.9 12,771.2 3,196.5 3,551.0 Credits to credit institutions (Note 3). . . . . . . . . . . . Credits to the public (Note 3) . . . . . . . . . . . . . . . . . . 20,551.7 20,551.7 3,693.8 19,948.4 19,948.4 Other interest-bearing securities . . . . . . . . . . . . . . . . 132,114.1 132,114.1 - 115,279.2 115,279.2 - Of which current assets. . . . . . . . . . . . . . . . . . . . . . (97,122.4) (97,122.4) - (84,150.1) (84,150.1) - Of which fixed assets . . . . . . . . . . . . . . . . . . . . . . . (34,991.7) (34,991.7) - (31,129.1) (31,129.1) - (34,503.2) (34,503.2) - (31,106.2) (31,106.2) - Shares in subsidiaries.. . . . . . . . . . . . . . . . . . . . . . . . n.a. 118.5 - n.a. 118.5 - Non-financial assets . . . . . . . . . . . . . . . . . . . . . . . . . 210.2 96.8 - 215.7 101.8 - Other assets. . . . . . . . . . . . . . . . . . . . . . . . . . . . . . . . 10,112.6 10,189.5 2.1 7,676.7 7,752.7 0.9 Of which credits (Note 2) . . . . . . . . . . . . . . . . Prepaid expenses and accrued revenues. . . . . . . . . . . 3,461.1 3,460.8 88.3 3,463.0 3,462.9 104.1 Total assets (Note 4) . . . . . . . . . . . . . . . . . . . . . . . . 178,545.0 178,624.0 6,966.7 162,066.2 162,144.0 6,912.2 Borrowing from credit institutions. . . . . . . . . . . . . . 858.9 868.9 1.4 700.9 710.9 1.5 Borrowing from the public. . . . . . . . . . . . . . . . . . . . 74.8 79.7 0.0 81.1 86.0 0.0 Senior securities issued. . . . . . . . . . . . . . . . . . . . . . . 157,883.3 157,883.3 353.9 140,348.6 140,348.6 524.7 Other liabilities. . . . . . . . . . . . . . . . . . . . . . . . . . . . . 9,652.4 9,691.4 128.8 11,177.6 11,218.5 103.8 LIABILITIES, ALLOCATIONS AND SHAREHOLDERS' FUNDS Lending/(borrowing) between SEK and the S-system . . . . . . . . . . . . . . . . . . . . . . . . . . . . - - 6,413.0 - - 6,170.9 Accrued expenses and prepaid revenues. . . . . . . . . . 3,277.0 3,275.7 69.6 3,210.1 3,207.6 111.3 Allocations. . . . . . . . . . . . . . . . . . . . . . . . . . . . . . . . . 391.3 17.5 - 391.4 17.6 - 2,927.9 2,927.9 - 2,764.7 2,764.7 - Total liabilities and allocations . . . . . . . . . . . . . . . . . 175,065.6 174,744.4 6,966.7 158,674.4 158,353.9 6,912.2 Untaxed reserves. . . . . . . . . . . . . . . . . . . . . . . . . . . . n.a. 1,334.6 - n.a. 1,334.6 - Subordinated securities issued . . . . . . . . . . . . . . . Share capital . . . . . . . . . . . . . . . . . . . . . . . . . . . . . . 990.0 990.0 - 990.0 990.0 - Non-distributable reserves . . . . . . . . . . . . . . . . . . . . 1,173.3 211.9 - 1,170.8 209.4 - Total non-distributable capital . . . . . . . . . . . . . . . . . 2,163.3 1,201.9 - 2,160.8 1,199.4 - Profit carried forward . . . . . . . . . . . . . . . . . . . . . . . . 1,228.5 1,253.6 - 791.4 808.5 - Net profit for the period . . . . . . . . . . . . . . . . . . . . . . 87.6 89.5 - 439.6 447.6 - Total distributable capital . . . . . . . . . . . . . . . . . . . . . 1,316.1 1,343.1 - 1,231.0 1,256.1 - Total shareholders' funds. . . . . . . . . . . . . . . . . . . . . . 3,479.4 2,545.0 - 3,391.8 2,455.5 - 178,545.0 178,624.0 6,966.7 162,066.2 162,144.0 6,912.2 None None None None None None Subject to lending . . . . . . . . . . . . . . . . . . . . . . . . . . 104.2 104.2 - 98.5 98.5 - CONTINGENT LIABILITIES . . . . . . . . . . . . . . . None None None None None None 16,851.3 16,851.3 10,269.9 16,352.6 16,352.6 10,225.6 Total liabilities, allocations and shareholders' funds . . . . . . . . . . . . . . . . . . . . . COLLATERAL PROVIDED Collateral provided . . . . . . . . . . . . . . . . . . . . . . . . . . Interest-bearing securities COMMITMENTS Committed undisbursed credits.. . . . . . . . . . . . . . . . Specification of Change in Shareholders' Funds Consolidated Group (Skr mn) January-March, 2005 January-December, 2004 Opening balance of shareholders' funds . . . . . . . . . . 3,391.8 2,952.2 Dividend paid . . . . . . . . . . . . . . . . . . . . . . . . . . . . . . - - Net profit for the period . . . . . . . . . . . . . . . . . . . . . . Closing balance of shareholders' funds . . . . . . . . 87.6 439.6 3,479.4 3,391.8 4 (7) STATEMENTS OF CASH FLOWS, SUMMARY January-March, 2005 (Skr mn) Net cash (used in)/provided by operating activities January-March, 2004 Consolidated Group Parent Company Consolidated Group Parent Company -17,847.6 -17,847.6 -11,222.8 -11,222.8 Net cash (used in)/provided by investing activities -2.0 -2.0 -9.5 -9.5 Net cash (used in)/provided by financing activities 17,849.6 17,849.6 11,232.3 11,232.3 0.0 0.0 0.0 0.0 Cash and cash equivalents at end of period According to Capital Adequacy Requirements under Swedish Law, which are in Compliance with International Guidelines. However, the adjusted capital adequacy ratios shown below, are calculated with inclusion in the Tier-1 capital base of SEK's guarantee capital of Skr 600 million in addition to the regulatory approved capital base. (Amounts in Skr mn) Consolidated Group On-balance sheet items . . . . . . . . . . . . . Off-balance sheet items . . . . . . . . . . . . . Other exposures . . . . . . . . . . . . . . . . . . . Total . . . . . . . . . . . . . . . . . . . . . . . . . . . . March 31, 2005 Weighted Claims claims 178,545 36,276 18,466 3,464 n.a. 0 197,011 39,740 Breakdown by category: A. Riskweight 0% . . . . . . . . . . . . . . . B1. Riskweight 10% . . . . . . . . . . . . . . B2. Riskweight 20% . . . . . . . . . . . . . . C. Riskweight 50% . . . . . . . . . . . . . . . D. Riskweight 100% . . . . . . . . . . . . . . . E. Market exposures. . . . . . . . . . . . . . . . Total . . . . . . . . . . . . . . . . . . . . . . . . . . . . 49,535 5,548 105,880 435 14,730 20,883 197,011 I. Capital requirement -555 21,176 217 14,730 3,062 39,740 Required capital 2,902 277 0 3,179 -44 1,694 17 1,178 246 3,179 December 31, 2004 Weighted Required Claims claims capital 162,066 34,385 2,751 17,273 2,891 232 e.t. 36 3 179,339 37,312 2,986 Parent Company March 31, 2005 December 31, 2004 Weighted Required Weighted Required Claims claims capital Claims claims capital 178,624 36,357 2,909 162,144 34,466 2,757 18,466 3,464 277 17,273 2,891 232 n.a. 0 0 e.t. 36 3 197,090 39,821 3,186 179,417 37,393 2,992 46,327 4,183 96,291 816 14,470 17,252 179,339 49,535 5,548 105,877 435 14,812 20,883 197,090 418 19,258 408 14,470 2,758 37,312 33 1,541 33 1,158 221 2,986 II. Capital base (A) Tier-1 capital . . . . . . . . . . . . . . . . . . . . . Tier-2 capital . . . . . . . . . . . . . . . . . . . . . Of which: Upper Tier-2 . . . . . . . . . . . . . . . . . . . . Lower Tier-2 . . . . . . . . . . . . . . . . . . . . Total . . . . . . . . . . . . . . . . . . . . . . . . . . . . Parent Company 3/2005 12/2004 3,960 3,852 2,402 2,252 1,949 457 6,335 1,806 450 6,079 1,945 457 6,362 1,802 450 6,104 4,529 6,935 4,423 6,679 4,560 6,962 4,452 6,704 Total . . . . . . . . . . . . . . . . . Of which: Tier-1 ratio . . . . . . . . . . . Tier-2 ratio . . . . . . . . . . . Of which: Upper Tier-2 ratio . . . . Lower Tier-2 ratio . . . . Adjusted Total. . . . . . . . . . Of which: Adj. Tier-1 ratio. IV. Specification of off-balance sheet items (B) Consolidated Group and Parent Company: December 31, 2004 Derivative financial contracts: Currency related agreements . . . . . . . . . Interest rate related contracts . . . . . . . . . Equity related contracts . . . . . . . . . . . . . Commodity related contracts, etc. . . . . . Total derivative contracts . . . . . . . . . . . . Other off-balance sheet contracts and commitments: Repurchase agreements etc. (repos) . . . . Undisbursed credits . . . . . . . . . . . . . . . . Total. . . . . . . . . . . . . . . . . . . . . . . . . . . . -44 1,694 17 1,185 246 3,186 46,327 4,183 96,288 816 14,551 17,252 179,417 418 19,258 408 14,551 2,758 37,393 33 1,541 33 1,164 221 2,992 III. Capital Adequacy Ratio Consolidated Group 3/2005 12/2004 3,929 3,823 2,406 2,256 Adjusted Tier-1 capital. . . . . . . . . . . . . . Adjusted Total. . . . . . . . . . . . . . . . . . . . March 31, 2005 Derivative financial contracts Currency related agreements . . . . . . . . . Interest rate related contracts . . . . . . . . . Equity related contracts . . . . . . . . . . . . . Commodity related contracts, etc. . . . . . Total derivative contracts . . . . . . . . . . . . Other off-balance sheet contracts and commitments: Repurchase agreements etc. (repos) . . . . Undisbursed credits . . . . . . . . . . . . . . . . Total. . . . . . . . . . . . . . . . . . . . . . . . . . . . -555 21,175 217 14,812 3,062 39,821 Nominal amounts Converted claims Of which: Positive real exposures Negative Potential real exposures exposures Weighted claims 128,021 163,355 44,589 2,938 338,903 4,435 1,264 4,008 229 9,936 1,662 724 671 4 3,061 2,773 540 3,337 225 6,875 4,303 6,704 1,084 197 12,288 921 279 848 46 2,094 104 16,851 355,858 104 8,426 18,466 --3,061 104 8,426 15,405 --12,288 -1,370 3,464 113,687 124,437 45,199 2,499 285,822 3,746 1,018 4,037 198 8,999 908 641 629 4 2,182 2,838 377 3,408 194 6,817 7,399 6,799 1,008 177 15,383 763 225 842 98 1,928 98 16,353 302,273 98 8,176 17,273 --2,182 98 8,176 15,091 --15,383 -963 2,891 Consolidated Group 3/2005 12/2004 16.0% 16.3% Parent Company 3/2005 12/2004 16.0% 16.3% 9.9% 6.1% 10.2% 6.1% 10.0% 6.0% 10.3% 6.0% 4.9% 1.2% 17.5% 11.4% 4.9% 1.2% 17.9% 11.9% 4.9% 1.1% 17.5% 11.5% 4.8% 1.2% 17.9% 11.9% Book value on-balance sheet Related to derivative Related to derivative contracts with positive contracts with negative real exposures: real exposures: Positive Negative Positive Negative book book book book values values values values 1,790 205 17 -2,012 1,503 3,154 641 -5,298 3,562 953 621 7 5,143 513 43 4 -560 827 129 18 -974 2,300 3,113 556 -5,969 4,022 1,068 575 -5,665 3,167 64 8 -3,239 (A) The capital base includes the profit for the year 2004. The capital base also includes the profit for the three-month period ended March 31, 2005, less expected dividend related to said period. (B) In accordance with SEK’s policies with regard to counterparty, interest rate, and currency exchange exposures, SEK uses, and is a party to, different kinds of off-balance sheet financial instruments, mostly various interest rate related and currency exchange related contracts (swaps, etc). It is worth noting that the nominal amounts of such derivative instruments do not reflect real exposures, but merely constitute the basis from which the exposures (converted claims) are derived. 5 (7) COUNTERPARTY RISK EXPOSURES (Skr mn) Consolidated Group and Parent Company: Total March 31, 2005 December 31, 2004 Classified by type of counterparty State Municipalities Mortgage institutions Banks Other credit institutions Corporations Total Amount 25.4 11.5 5.8 87.4 36.9 16.1 183.1 % 14 6 3 48 20 9 100 Amount 25.4 10.5 4.3 77.1 35.7 14.9 167.9 % 15 6 3 46 21 9 100 Credits & Interestbearing securities March 31, 2005 December 31, 2004 Amount 19.5 11.2 5.8 80.9 32.4 14.9 164.7 % 12 7 3 49 20 9 100 Amount 19.4 10.1 4.3 71.5 31.2 14.2 150.7 % 13 7 3 47 21 9 100 Derivatives, Undisbursed credits, etc. March 31, 2005 December 31, 2004 Amount 5.9 0.3 6.5 4.5 1.2 18.4 % 32 2 35 24 7 100 Amount 6.0 0.4 5.6 4.5 0.7 17.2 % 35 2 33 26 4 100 NOTES Accounting principles: The accounting principles described in SEK’s Annual Report for the year 2004 have been applied unchanged. Implementation of International Financial Reporting Standards: According to the EU directives on the application of international accounting standards, consolidated accounts of companies with listed debt or equity instruments should be prepared in conformity with the International Financial Reporting Standards (“IFRS”) that have been endorsed for application in the EU from January 1, 2005. However, according to article 9 of the regulation, EU member states may decide that companies that have issued listed debt securities but not issued listed equity instruments in a regulated market in the EU may start the application of IFRS from January 1, 2007. It is suggested that this possibility is implemented in Swedish law. Since SEK will be subject to these transitional provisions, due to the fact that SEK has issued listed debt securities but not issued listed equity instruments, the application of IFRS will not be compulsory for SEK until January 1, 2007. SEK has identified the accounting rules for financial instruments that are contained in IAS 39 and IAS 32 as the area where the implementation of IFRS will have the highest impact compared to present accounting policies. Specifically, the detailed rules for hedge accounting in IAS 39 will create the most significant amendments to SEK’s present accounting policies. The present rules for hedge accounting according to Swedish GAAP differ significantly from the rules in IAS 39. A conversion project for applying IFRS is in progress. The project is still in an assessment phase regarding which methods for hedge accounting or equivalent to be used in accordance to IAS 39. No quantitative impact studies have been finalized. Note 1. Reported amounts of taxes for the three-month period ended March 31 represent profits before appropriation multiplied by the standard tax rate (28%), and, as from 2005, due to new tax regulation, with addition to certain tax costs related to holding untaxed reserves. No allocations to, dissolutions of, untaxed reserves have been made before the calculation of taxes. Such allocations, or dissolutions, may be determined only on a full-year basis. Note 2. Represents credits granted against documentation in the form of interest-bearing securities. Note 3. In accordance with the Swedish Financial Supervisory Authority’s regulations, the Company reports credits with principal or interest more than 60 days past-due as past-due credits. The aggregate past-due amount of principal and interest on such credits was Skr 0.0 million (y-e: 0.0). The principal amount not past due on such credits was Skr 0.0 million (y-e: 0.0). Note 4. The amount of total assets at period-end, Skr 178.5 billion, was approximately Skr 3.7 billion higher than it would have been if the currency exchange rates as of December 31, 2004, had been unchanged. Note 5. Earnings per share: Net profit for the period divided by the number of shares. . AB Svensk Exportkredit/Swedish Export Credit Corporation (publ), Västra Trädgårdsgatan 11B, P.O. Box 16368, SE-103 27 Stockholm, Phone +46 8 613 83 00, Corp Id No 556084-0315. www.sek.se 6 (7) Stockholm, May 13, 2005 AB SVENSK EXPORTKREDIT Swedish Export Credit Corporation Peter Yngwe President Auditors’ Review Report We have reviewed the interim report for the three-month period ended March 31, 2005, in accordance with Swedish generally accepted standards for such reviews. A review is significantly less in scope than an examination in accordance with generally accepted auditing standards. During our review nothing came to our attention to indicate that the interim report does not comply with the requirements of the Swedish Act on Annual Accounts for Credit Institutions and Securities Companies. Stockholm, May 13, 2005 Gunnar Abrahamson Authorized Public Accountant (Appointed by the Swedish Financial Supervisory Authority) Per Bergman Authorized Public Accountant Curt Öberg Authorized Public Accountant (Appointed by the Swedish National Audit Office) References herein to “Skr” mean Swedish kronor.The exchange rate on March 31, 2005, was Swedish kronor 7.0600 to the US dollar (March 31, ,2004: 7.565; December 31, 2004: 6.6125).Amounts stated herein relate to March 31 or December 31, in the case of positions, and the three--month period ended March 31 or the twelve-month period ended December 31, in the case of flows, unless otherwise indicated. Amounts within parenthesis relate to the same date, in the case of positions, and to the same period, in the case of flows, for the preceding year, unless otherwise indicated. References herein to “credits” mean credits as defined under the “old format”, unless otherwise indicated. This Interim Report contains forward-looking statements. Forward-looking statements are statements that are not historical facts, including statements about our beliefs, expectations and intentions. Forward-looking statements are based on current plans, estimates and projections. Forward-looking statements speak only as of the date they are made, and the Company undertakes no obligation to update any forward-looking statement in light of new information or future events. Forward-looking statements involve inherent risks and uncertainties, most of which are difficult to predict and generally beyond the Company’s control. You are cautioned that a number of important factors could cause actual results or outcomes to differ materially from those expressed in, or implied by, the forward-looking statements. These factors include, among others, changes in general economic business conditions, especially in Sweden, changes and volatility in currency exchange and interest rates; and changes in government policy and regulations and in political and social conditions. AB Svensk Exportkredit/Swedish Export Credit Corporation (publ), Västra Trädgårdsgatan 11B, P.O. Box 16368, SE-103 27 Stockholm, Phone +46 8 613 83 00, Corp Id No 556084-0315. www.sek.se 7(7)
