Answers - Boston College
advertisement
Mathematics 004
Robert Gross
Homework 1
Answers
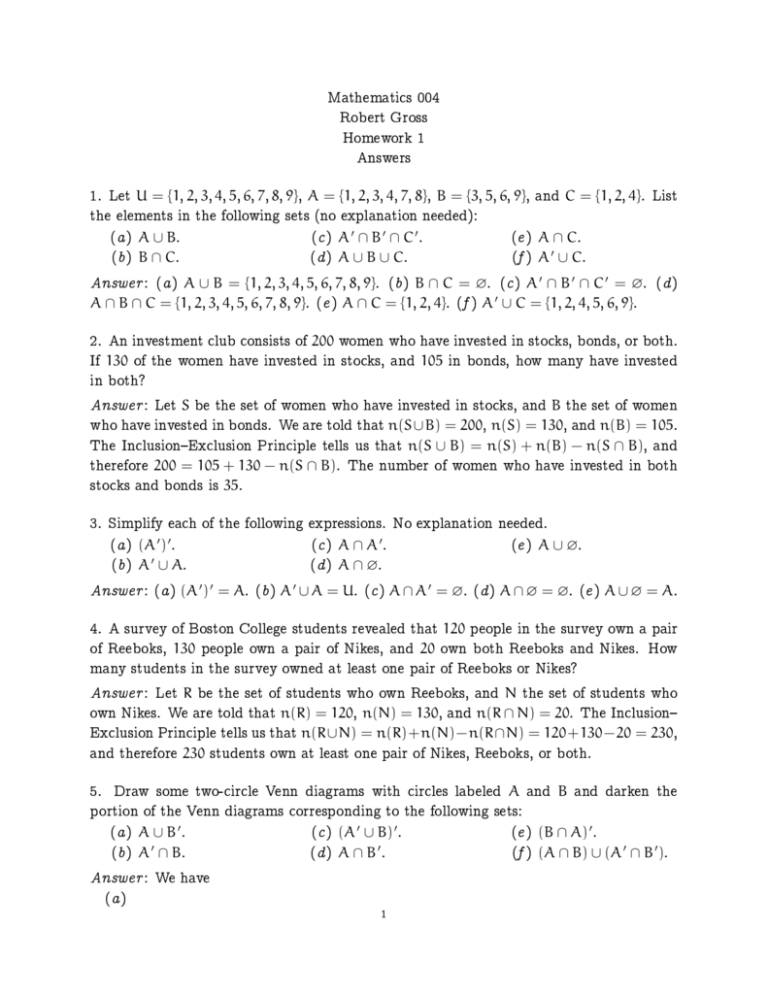
1. Let U = {1, 2, 3, 4, 5, 6, 7, 8, 9}, A = {1, 2, 3, 4, 7, 8}, B = {3, 5, 6, 9}, and C = {1, 2, 4}. List
the elements in the following sets (no explanation needed):
(a ) A ∪ B.
(c ) A 0 ∩ B 0 ∩ C 0 .
(e ) A ∩ C .
(b ) B ∩ C .
(d ) A ∪ B ∪ C .
(f ) A 0 ∪ C .
Answer : (a ) A ∪ B = {1, 2, 3, 4, 5, 6, 7, 8, 9}. (b ) B ∩ C = ∅. (c ) A 0 ∩ B 0 ∩ C 0 = ∅. (d )
A ∩ B ∩ C = {1, 2, 3, 4, 5, 6, 7, 8, 9}. (e ) A ∩ C = {1, 2, 4}. (f ) A 0 ∪ C = {1, 2, 4, 5, 6, 9}.
2. An investment club consists of 200 women who have invested in stocks, bonds, or both.
If 130 of the women have invested in stocks, and 105 in bonds, how many have invested
in both?
Answer : Let S be the set of women who have invested in stocks, and B the set of women
who have invested in bonds. We are told that n(S∪B) = 200, n(S) = 130, and n(B) = 105.
The Inclusion{Exclusion Principle tells us that n(S ∪ B) = n(S) + n(B) − n(S ∩ B), and
therefore 200 = 105 + 130 − n(S ∩ B). The number of women who have invested in both
stocks and bonds is 35.
3. Simplify each of the following expressions. No explanation needed.
(a ) (A 0 ) 0 .
(c ) A ∩ A 0 .
(e ) A ∪ ∅.
0
(b ) A ∪ A .
(d ) A ∩ ∅.
Answer : (a ) (A 0) 0 = A. (b ) A 0 ∪ A = U. (c ) A ∩ A 0 = ∅. (d ) A ∩ ∅ = ∅. (e ) A ∪ ∅ = A.
4. A survey of Boston College students revealed that 120 people in the survey own a pair
of Reeboks, 130 people own a pair of Nikes, and 20 own both Reeboks and Nikes. How
many students in the survey owned at least one pair of Reeboks or Nikes?
Answer : Let R be the set of students who own Reeboks, and N the set of students who
own Nikes. We are told that n(R) = 120, n(N) = 130, and n(R ∩ N) = 20. The Inclusion{
Exclusion Principle tells us that n(R∪N) = n(R)+n(N)−n(R∩N) = 120+130−20 = 230,
and therefore 230 students own at least one pair of Nikes, Reeboks, or both.
5. Draw some two-circle Venn diagrams with circles labeled A and B and darken the
portion of the Venn diagrams corresponding to the following sets:
(a ) A ∪ B 0 .
(c ) (A 0 ∪ B) 0 .
(e ) (B ∩ A) 0 .
(b ) A 0 ∩ B.
(d ) A ∩ B 0 .
(f ) (A ∩ B) ∪ (A 0 ∩ B 0 ).
Answer : We have
(a )
1
U
A
B
A
B
(b )
U
(c ) and (d ) are identical because of de Morgan's Laws:
U
A
B
A
B
A
B
(e )
U
(f )
U
6. Draw some two-circle Venn diagrams with circles labeled A and B. Use this information
to compute the number of elements of each basic region.
(a ) n(U) = 15, n(A) = 7, n(B) = 6, n(A ∩ B) = 2.
(b ) n(A) = 3, n(A ∪ B) = 6, n(B) = 4, n(A 0 ∪ B 0 ) = 11.
(c ) n(A) = 9, n(B) = 11, n(A ∩ B) = 5, n(A 0 ) = 14.
Answer : We have:
2
(a )
U
5
A
4
2
B
4
(b )
U
2
A
3
1
B
6
(c )
U
4
A
6
5
B
8
7. The Standard and Poor's Index measures the average price of a collection of 500 stocks.
The table at the end of this question gives the percentage change in the S&P for the
rst 5 business days of the year and the percentage change for the entire year, for years
1984{2011. Let
U = {1984, 1985, . . . , 2010, 2011}
A = {all years in which the index declined during the rst 5 business days}
B = {all years in which the index increased during the entire year}
C = {all years in which the index declined more than 2% during the entire year}
List the elements of the following sets
(a ) A .
(c ) C .
(b ) B.
(d ) A ∩ B.
(e ) A ∪ C .
(f ) B 0 ∩ C .
Answer : We have:
(g ) (A ∩ B) ∪ C.
(h ) A ∩ (B ∪ C).
A = {1985, 1986, 1988, 1991, 1993, 1998, 2000, 2001, 2005, 2007, 2008}
B = {1984, 1985, 1986, 1987, 1988, 1989, 1991, 1992, 1993, 1995, 1996, 1997,
1998, 1999, 2003, 2004, 2005, 2006, 2007, 2009, 2010}
3
C = {1990, 2000, 2001, 2002, 2008}
A ∩ B = {1985, 1986, 1988, 1991, 1993, 1998, 2005, 2007}
A ∪ C = {1985, 1986, 1988, 1990, 1991, 1993, 1998, 2000, 2001, 2002, 2005, 2007, 2008}
B 0 ∩ C = {1990, 2000, 2001, 2002, 2008}
(A ∩ B) ∪ C = {1985, 1986, 1988, 1990, 1991, 1993, 1998, 2000, 2001, 2002, 2005, 2007, 2008}
A ∩ (B ∪ C) = {1985, 1986, 1988, 1991, 1993, 1998, 2000, 2001, 2005, 2007, 2008}
Percentage change in S&P :
Year
2011
2010
2009
2008
2007
2006
2005
2004
2003
2002
2001
2000
1999
1998
Percent change
for rst 5 days
1 .1
2 .7
0 .7
−5.3
−0.4
3 .0
−2.1
1 .8
3 .4
1 .1
−1.9
−1.9
3 .7
−1.5
Percent change
for year
0.0
12.8
23.5
−38.5
4.8
13.6
3.0
9.0
26.4
−23.4
−13.0
−10.1
19.5
26.7
Year
1997
1996
1995
1994
1993
1992
1991
1990
1989
1988
1987
1986
1985
1984
4
Percent change
for rst 5 days
1.0
0.4
0.3
0.7
−1.5
0.2
−4.6
0.1
1.2
−1.5
6.2
−1.6
−1.9
2.4
Percent change
for year
31.0
20.3
34.1
−1.5
7.1
4.5
26.3
−6.6
27.3
12.4
2.0
14.6
26.3
1.4
