RIT - People
advertisement
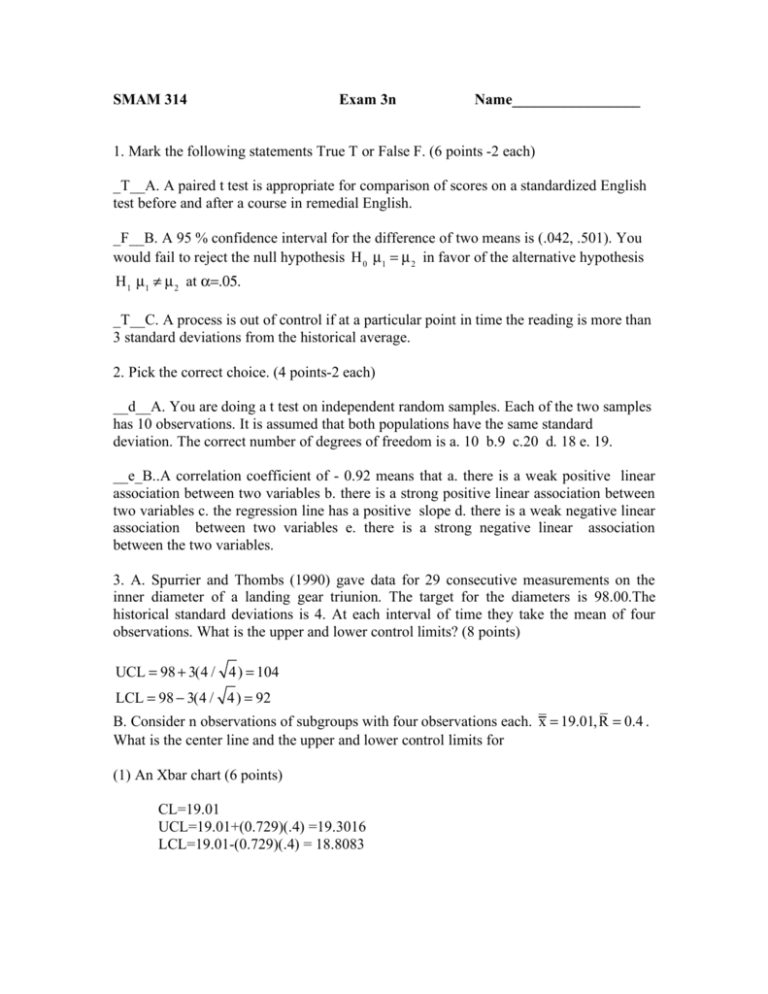
SMAM 314 Exam 3n Name_________________ 1. Mark the following statements True T or False F. (6 points -2 each) _T__A. A paired t test is appropriate for comparison of scores on a standardized English test before and after a course in remedial English. _F__B. A 95 % confidence interval for the difference of two means is (.042, .501). You would fail to reject the null hypothesis H 0 µ1 = µ 2 in favor of the alternative hypothesis H1 µ1 ! µ 2 at α=.05. _T__C. A process is out of control if at a particular point in time the reading is more than 3 standard deviations from the historical average. 2. Pick the correct choice. (4 points-2 each) __d__A. You are doing a t test on independent random samples. Each of the two samples has 10 observations. It is assumed that both populations have the same standard deviation. The correct number of degrees of freedom is a. 10 b.9 c.20 d. 18 e. 19. __e_B..A correlation coefficient of - 0.92 means that a. there is a weak positive linear association between two variables b. there is a strong positive linear association between two variables c. the regression line has a positive slope d. there is a weak negative linear association between two variables e. there is a strong negative linear association between the two variables. 3. A. Spurrier and Thombs (1990) gave data for 29 consecutive measurements on the inner diameter of a landing gear triunion. The target for the diameters is 98.00.The historical standard deviations is 4. At each interval of time they take the mean of four observations. What is the upper and lower control limits? (8 points) UCL = 98 + 3(4 / 4) = 104 LCL = 98 ! 3(4 / 4) = 92 B. Consider n observations of subgroups with four observations each. x = 19.01, R = 0.4 . What is the center line and the upper and lower control limits for (1) An Xbar chart (6 points) CL=19.01 UCL=19.01+(0.729)(.4) =19.3016 LCL=19.01-(0.729)(.4) = 18.8083 (2)A range chart? (6 points) CL=0.4 UCL=2.282(.4)=.9128 LCL =0 4. The data below resulted from an experiment in which weld diameter x and shear strength y in pounds were determined for five different spots on steel x 200.1 210.1 220.1 230.1 240.0 y 813.7 785.3 960.4 1118.0 1076.2 A. Use your calculator to fit the regression line. Regression equation = __y=8.599x-941.7_______________ (5 points) B. What percentage of the variation is accounted for by the regression? (1 point) 81.9% C. What is the correlation coefficient? (1 point) R= .904 D. Predict y when x = 225. (5 points) Y =8.599(225) -941.7 =993.075 E. The standard error of the slope is 2.337. A confidence interval for the slope would be b ± t !/2,n"2se(b) (1)Find a 98% confidence interval for b.(5 points) 8.599 ± 4.541(2.337) 8.599 ± 10.6123 (!2.0223,19.2113) (2) Based only on the confidence interval would you reject H0 slope=0 in favor of H1 slope≠0 at α=.02. Explain you answer. (3 points) You would fail to reject H0. The confidence interval contains zero. 5. A large automobile manufacturing company is trying to decide whether to purchase brand A or brand B tires for its new models. To help arrive at a decision an experiment is conducted using 12 of each brand. The tires are run until they wear out. The summary statistics are Brand A: x1 = 37,900,s1 = 5100 kilometers Brand B : x 2 = 39,800,s 2 = 5900 kilometers A. Test the hypothesis at α=.05 that there is no difference in the two brands of tires. Assume the populations are approximately normal with equal variances. (15 points) H 0 µ1 = µ 2 H 1 µ1 ! µ 2 Assumptions Independent random samples. Equal but unknown variances Normal populations Region of rejection T>2.074 T< –2.074 Calculation x1 ! x 2 T= sp s 2p = 1 1 + n1 n 2 (n1 ! 1)s12 + (n 2 ! 1)s 22 n1 + n 2 ! 2 11(5100)2 + 11(5900)2 = 30410000 22 s p = 5514.5 s 2p = T= 37900 ! 39800 5514.5 1 1 + 12 12 = !1900 = !.844 2251.3 Reject or do not reject H0+ Cannot reject H0 Conclusion There is insufficient evidence to show that the mileage for the two kinds of tires is significantly different. B.(1) Find a 95% confidence interval for the difference between the mean wearout mileage of the tires x1 ! x 2 ± t "/ 2,n +n !2s p 1 2 1 1 (7 points) + n1 n 2 !1900 ± 2.074(5514.5) 1 1 + 12 12 !1900 ± 4669.1 (!6569.1,2769.1) (2) Is this confidence interval consistent with the results of the test of hypothesis.?Explain. (3 points) Yes it is because it contains zero. C. Consider the Minitab output below Is the assumption of equal variances justified. Explain your answer given specific reference to the above computer output. (3 points) The assumption would be justified because the p value of the F statistic is .75 greater than .05. 6. A taxi company manger is trying to decide whether the use of radial tires instead of regular belted tires improves fuel economy. Twelve cars were equipped with radian tires and driven over a prescribed test course . Without changing drivers the same cars were equipped with regular belted tires and driven once again over the test course. The gasoline consumption in kilometers per liter was recorded as follows, Row 1 2 3 4 5 6 7 8 9 10 11 12 Radial Tires 4.2 4.7 6.6 7.0 6.7 4.5 5.7 6.0 7.4 4.9 6.1 5.2 Belted Tires 4.1 4.9 6.2 6.9 6.8 4.4 5.7 5.8 6.9 4.7 6.0 4.9 Difference 0.1 -0.2 0.4 0.1 -0.1 0.1 0.0 0.2 0.5 0.2 0.1 0.3 Consider the normal probability plot below. A. Based on this normal probability plot is it reasonable to assume that the differences between the mileages for radial and belted tires is normally distributed? Explain. (3 points) The points lie close to a straight line so the mileages are probably normally distributed. B. The goal is to determine by a test of hypothesis whether the cars equipped with radial tires give better fuel economy than those equipped with belted tires. The Minitab output follows. Paired T-Test and CI: Radial Tires, Belted Tires Paired T for Radial Tires - Belted Tires Radial Tires Belted Tires Difference N 12 12 12 Mean 5.750 5.608 0.1417 StDev 1.053 0.994 0.1975 SE Mean 0.304 0.287 0.0570 95% lower bound for mean difference: 0.0393 T-Test of mean difference = 0 (vs > 0): T-Value = 2.48 P-Value = 0.015 (1) What is the null and the alternative hypothesis for this test? (2 points) H0 µ R = µ B H1 µ R > µ B (2) Besides the fact that the differences are normally distributed what other important characteristic of this data set must be included in the assumptions? (2 points) Paired data (3) What is the value of the test statistic and the P value? (2 points) T= 2.48 pvalue =.015 (4) At α =.05 would you conclude that radial tires give better fuel economy than belted tires? Explain.(3 points) Yes because the pvalue is .015<.05 (5) At α =.01 would you conclude that radial tires give better fuel economy than belted tires? Explain.(3 points) No because the pvalue is .015>.01 (6) Find a 99% lower confidence bound on the mean of the differences between radial and belted tires and explain how your result is or is not consistent with the p value given in the computer output. (7 points) LCB = .1417 ! 2.718(.1975) / 12 LCB = !.0132 The one sided confidence interval (-.0132,∝) does contain zero.The p value was .015 so the hypothesis would not be rejected at α=.01.

