Google Case Study | AdWords
lastminute.com’s 12-week geo‐experiment
reveals a 43% uplift in Google AdWords values
Background
lastminute.com is an online travel and leisure retailer, with over 1.6 million
site visitors per week. It pioneered the online travel and leisure industry by
offering its customers a 5-star lifestyle for 3-star prices, selling everything
from flights, hotels, gifts and restaurants to theatre tickets.
About lastminute.com
yy
yy
yy
yy
Part of Travelocity and Sabre
Holdings
Leading UK online travel and leisure
retailer, with over 1.6 million visitors
per week
This experiment was designed
and conducted by the lastminute.
com Marketing Analytics team,
including William Beckler, Krzysztof
Osiewalski, Adam Roman and
Kamil Bartocha
lastminute.com’s PPC campaigns
are managed by their in-house
PPC team
Goals
yy
yy
Drive search ROI through accurate
attribution
Understand the value of generic
search in the purchase funnel
lastminute.com recently conducted a series of sophisticated and rigorously
designed online geo-experiments aimed at gaining insight into the full value
of their generic (non‐brand) Google AdWords activity. The company set out
to determine whether there was an incremental factor from Google non‐
branded AdWords campaigns which was being attributed to other channels
by lastminute.com’s own internal tracking systems. This analysis included a
study of both online and offline conversions.
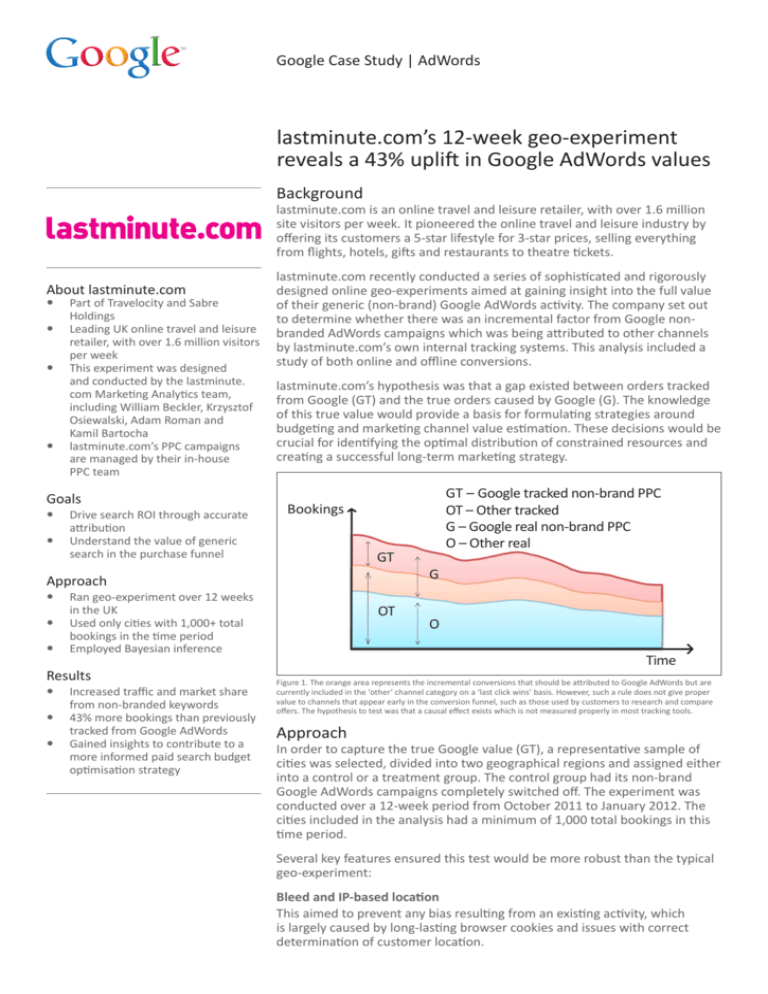
lastminute.com’s hypothesis was that a gap existed between orders tracked
from Google (GT) and the true orders caused by Google (G). The knowledge
of this true value would provide a basis for formulating strategies around
budgeting and marketing channel value estimation. These decisions would be
crucial for identifying the optimal distribution of constrained resources and
creating a successful long-term marketing strategy.
GT
Approach
yy
yy
yy
Ran geo‐experiment over 12 weeks
in the UK
Used only cities with 1,000+ total
bookings in the time period
Employed Bayesian inference
Results
yy
yy
yy
Increased traffic and market share
from non-branded keywords
43% more bookings than previously
tracked from Google AdWords
Gained insights to contribute to a
more informed paid search budget
optimisation strategy
GT – Google tracked non-brand PPC
OT – Other tracked
G – Google real non-brand PPC
O – Other real
Bookings
OT
G
O
Time
Figure 1. The orange area represents the incremental conversions that should be attributed to Google AdWords but are
currently included in the ‘other’ channel category on a ‘last click wins’ basis. However, such a rule does not give proper
value to channels that appear early in the conversion funnel, such as those used by customers to research and compare
offers. The hypothesis to test was that a causal effect exists which is not measured properly in most tracking tools.
Approach
In order to capture the true Google value (GT), a representative sample of
cities was selected, divided into two geographical regions and assigned either
into a control or a treatment group. The control group had its non‐brand
Google AdWords campaigns completely switched off. The experiment was
conducted over a 12-week period from October 2011 to January 2012. The
cities included in the analysis had a minimum of 1,000 total bookings in this
time period.
Several key features ensured this test would be more robust than the typical
geo-experiment:
Bleed and IP-based location
This aimed to prevent any bias resulting from an existing activity, which
is largely caused by long-lasting browser cookies and issues with correct
determination of customer location.
GT – Google tracked non-brand PPC
OT – Other tracked
Bookings
GT
Experiment
start
OT
Bleed
Time
Figure 2
Seasonality and city size drivers
An important observation that formed the basis of the experiment was that the
number of bookings from individual cities was highly correlated with an overall
trend, and that the ratio between these two values was fairly constant. Two
important drivers were identified. First, the seasonality trend (capturing special
events affecting the whole travel industry) and second, customer behaviour
varying between cities due to such factors as different offline marketing activities
in the past, demographic profile, brand awareness and so on.
Statistical approach
Due to the expected presence of multiple and unknown noise sources
measurement of estimation error and proper handling of uncertainty
was factored into the experiment.
Results and next steps
The core results of the study reveal
that for every tracked conversion that
was previously attributed to Google
AdWords, 1.43 conversions should
have been attributed in this way,
representing a 43% uplift (the posterior
distribution of X parameter can be
found in Figure 3). In other words,
turning off the non-branded search
terms in Google AdWords will result in
a 43% larger decline than reported by
lastminute.com’s tracking systems.
About Google AdWords
Google AdWords is a performance
based advertising program that enables
businesses large and small to advertise
on Google and its network of partner
websites. Hundreds of thousands of
businesses worldwide use AdWords
for text, image, and video ads priced
on a cost-per-click (CPC) and cost-perimpression (CPM) basis. Built on an
auction-based system,
AdWords is a highly quantifiable and
cost-effective way to reach potential
customers.
For more information, visit:
adwords.google.co.uk
Thanks to this insight, lastminute.
com’s next steps include adjusting
the brand’s paid search budget
optimisation strategy and engaging in
further investigation into the causal
effect of Google AdWords activity.
Appendix: lastminute.com’s
statistical model
“In each city (n) and week (t) we assume that the
total number of bookings (𝐵𝑛,𝑡) made through
our company is a sum of bookings coming in from
Google (𝐺𝑛,𝑡) and through other marketing channels
(𝑂𝑛,𝑡) including direct navigation, offline sales, white
labels, affiliate partners etc: 𝐵𝑛,𝑡=𝐺𝑛,𝑡+𝑂𝑛,𝑡.
As the traffic from non-Google marketing channels
may be different for each company or line of
business, we don’t want to model it separately and
assume a multiplicative seasonal and city related
trends: 𝑂𝑛,𝑡=𝐶𝑛∙𝑆𝑡.
The Google factor, (𝐺𝑛,𝑡) is an unknown variable
which can be modeled simply by the tracked
value (𝐺𝑇𝑛,𝑡) with an incremental adjustment (X):
𝐺𝑛,𝑡=𝑋∙𝐺𝑇𝑛,𝑡.
We assume the error factor to be also multiplicative
and strongly dependant on the seasonal
factors. The final model can thus be written as
𝐵𝑛,𝑡=𝑋∙𝐺𝑇𝑛,𝑡+𝐶𝑛∙𝑆𝑡+𝜀𝑛,𝑡 ,
where 𝜀𝑛,𝑡 denotes the t-distribution with ν>2
degrees of freedom. We abandon the normality
assumption of the error term – it can be verified a
posteriori. Because of different cities and seasonal
factors it is dubious that variance homoskedasticity
is valid. It is reasonable to assume heteroskedastic
variance and bind it to the 𝐶𝑛∙𝑆𝑡 factor.
For the success of the analysis it is crucial to handle
uncertainty in a proper way. Thus, the Bayesian
inference was applied. For all parameters of interest
we assume flat, but proper distributions. For the X
factor we assume a uniform distribution over the
[0.1, 4] interval.
Figure 3 “The posterior distribution of the incrmental
factor (X). q1 and q2 denote the 2.5% and 97.5%
posterior quantiles”.
To sample from the posterior distribution we used
the Markov Chain Monte Carlo algorithm based on
a hybrid structure of a Metropolis and Hastings step
within the Gibbs sampler. The posterior distribution
of X is presented in Fig. 3.
2012 Google inc. All rights reserved. Google and the Google logo are trademark of Google Inc.
All other company and product names may be trademark of the respective companies with which they are associated.

