sELf-sTudy sERiEs - Healthcare Purchasing News
advertisement
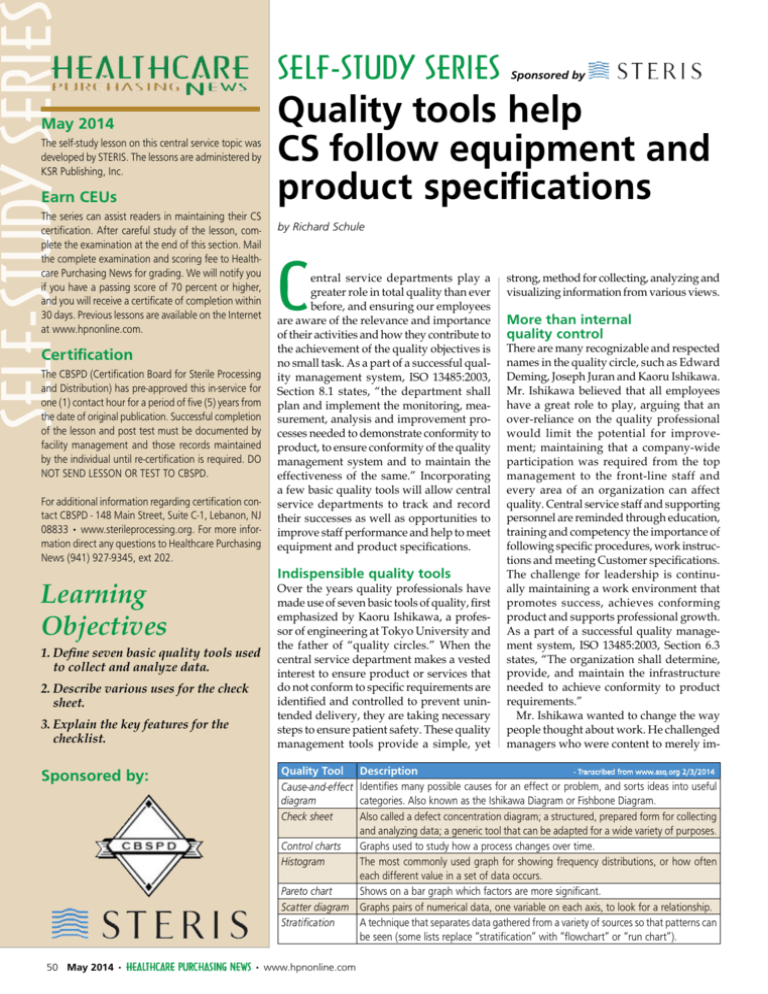
sELf-sTudy sERiE May 2014 The self-study lesson on this central service topic was developed by STERIS. The lessons are administered by KSR Publishing, Inc. Earn CEUs The series can assist readers in maintaining their CS certification. After careful study of the lesson, complete the examination at the end of this section. Mail the complete examination and scoring fee to Healthcare Purchasing News for grading. We will notify you if you have a passing score of 70 percent or higher, and you will receive a certificate of completion within 30 days. Previous lessons are available on the Internet at www.hpnonline.com. Certification The CBSPD (Certification Board for Sterile Processing and Distribution) has pre-approved this in-service for one (1) contact hour for a period of five (5) years from the date of original publication. Successful completion of the lesson and post test must be documented by facility management and those records maintained by the individual until re-certification is required. DO NOT SEND LESSON OR TEST TO CBSPD. For additional information regarding certification contact CBSPD - 148 Main Street, Suite C-1, Lebanon, NJ 08833 • www.sterileprocessing.org. For more information direct any questions to Healthcare Purchasing News (941) 927-9345, ext 202. Learning Objectives 1. Define seven basic quality tools used to collect and analyze data. 2. Describe various uses for the check sheet. 3. Explain the key features for the checklist. Sponsored by: sELf-sTudy sERiEs Sponsored by Quality tools help CS follow equipment and product specifications by Richard Schule C entral service departments play a greater role in total quality than ever before, and ensuring our employees are aware of the relevance and importance of their activities and how they contribute to the achievement of the quality objectives is no small task. As a part of a successful quality management system, ISO 13485:2003, Section 8.1 states, “the department shall plan and implement the monitoring, measurement, analysis and improvement processes needed to demonstrate conformity to product, to ensure conformity of the quality management system and to maintain the effectiveness of the same.” Incorporating a few basic quality tools will allow central service departments to track and record their successes as well as opportunities to improve staff performance and help to meet equipment and product specifications. Indispensible quality tools Over the years quality professionals have made use of seven basic tools of quality, first emphasized by Kaoru Ishikawa, a professor of engineering at Tokyo University and the father of “quality circles.” When the central service department makes a vested interest to ensure product or services that do not conform to specific requirements are identified and controlled to prevent unintended delivery, they are taking necessary steps to ensure patient safety. These quality management tools provide a simple, yet Quality Tool Cause-and-effect diagram Check sheet strong, method for collecting, analyzing and visualizing information from various views. More than internal quality control There are many recognizable and respected names in the quality circle, such as Edward Deming, Joseph Juran and Kaoru Ishikawa. Mr. Ishikawa believed that all employees have a great role to play, arguing that an over-reliance on the quality professional would limit the potential for improvement; maintaining that a company-wide participation was required from the top management to the front-line staff and every area of an organization can affect quality. Central service staff and supporting personnel are reminded through education, training and competency the importance of following specific procedures, work instructions and meeting Customer specifications. The challenge for leadership is continually maintaining a work environment that promotes success, achieves conforming product and supports professional growth. As a part of a successful quality management system, ISO 13485:2003, Section 6.3 states, “The organization shall determine, provide, and maintain the infrastructure needed to achieve conformity to product requirements.” Mr. Ishikawa wanted to change the way people thought about work. He challenged managers who were content to merely im- - Transcribed from www.asq.org 2/3/2014 Description Identifies many possible causes for an effect or problem, and sorts ideas into useful categories. Also known as the Ishikawa Diagram or Fishbone Diagram. Also called a defect concentration diagram; a structured, prepared form for collecting and analyzing data; a generic tool that can be adapted for a wide variety of purposes. Graphs used to study how a process changes over time. Control charts The most commonly used graph for showing frequency distributions, or how often Histogram each different value in a set of data occurs. Shows on a bar graph which factors are more significant. Pareto chart Scatter diagram Graphs pairs of numerical data, one variable on each axis, to look for a relationship. A technique that separates data gathered from a variety of sources so that patterns can Stratification be seen (some lists replace “stratification” with “flowchart” or “run chart”). 50 May 2014 • HEALTHCARE PuRCHAsing nEWs • www.hpnonline.com sELf-sTudy sERiEs Sponsored by prove a product’s quality, instead insisting that continuous quality improvement can always go one step further. He promoted the concept of company-wide quality control that called for continued Customer service. This level of service would extend throughout the company, including all levels of management and indeed even reaching into the everyday lives of those involved. Quality is perpetual motion and improvement of process through a systematic method of audits and review. The check sheet is one tool that can help to identify opportunities for process improvement. When to use a check sheet Check sheets are a simple form used to collect or record the frequency of occurrences for specific events during an identified data collection period. Check sheets can be directly coupled to histograms to provide a visualization of the data results. Check sheets are particularly useful: • When data can be observed and collected repeatedly by the same person or at the same location. • When there is a need to translate perceptions of what is happening into what is actually happening. • When collecting data on the frequency or patterns of events, problems, defects, defect location, defect causes, etc. • When collecting data from a production process. Check lists support quality processes Checklists, not to be confused with check sheets, are an excellent method for assuring specific requirements are followed. Some of the key features of the checklist are quantity and/or measurement of required specifications, parts, inventory or specific step in a sequence of events leading up to the final product. Checklists can be used for many functions: • Daily preparation of work stations before starting or ending shift. • Tray assembly, instrument count sheets. • Case cart build, preference cards. • Periodic audits of processes in SPD as well as other locations throughout the health care facility. ISO 13485:2003 supports the use of checklists as a method of monitoring product specifications. Initiating a checklist prior to starting shift work helps to ensure all accessories are present and support efficient operation. Checklists also identify short falls and opportunities to improve processes, training and reduction of non-conforming products. When the central service professional implements these basic quality tools they will benefit by: • Reducing defects. • Improving product quality. See Self-Study SerieS on page 52 Creating a check sheet 1. Decide what event or problem will be observed. Develop operational definitions. 2. Decide when data will be collected and for how long. 3. Design the form. Set it up that data can be recorded simply by making check marks. 4. Label all spaces on the form. 5. Test the check sheet for a short trial period to be sure it collects the appropriate data and is easy to use. 6. Each time the targeted event or problem occurs, record data on the check sheet. Track up to 10 defects on each day of the week. The illustration below shows a check sheet used to collect data on nonconforming events with Loaner Orthopedic Trays for the month of May. The check marks were added as data was collected over several weeks. Data collected is presented at the monthly department leadership and department staff meetings for discussion and subsequent review of existing procedures and work instructions. The data is also compared with the Corrective Action log as a check and balance of the department’s Corrective Action/Preventive Action (CAPA) policy. Defect Types/ Event Occurrence This visualization immediately allows us to focus our attention on missing instruments as the number one defect for loaner orthopedic trays. Equally remarkable are the delivery and pick-up times associated with these loaners. Possible next steps would have the team assemble and further illustrate and identify causes associated with these specific defects through the use of the cause-and-effect diagram. Nonconforming Events w/Loaner Orthopedic Trays – May 2013 Sunday Delivery <24 Hours Missing Instruments Wet Tray Dirty Instruments Instrument not Disassembled Broken Instrument Missing Trials Pick Up >24 Hours Monday Tuesday Wednesday Thursday Friday 0 2 6 7 Saturday 6 4 0 Total 6 11 2 1 1 0 0 4 25 Results collected from the Check Sheet for “Nonconforming Events w/Loaner Orthopedic Trays – May 2013” Self-Study Test Answers: 1. D, 2. B, 3. D, 4. A , 5. D , 6. C , 7. C , 8. B, 9. E, 10. E www.hpnonline.com • HEALTHCARE PuRCHAsing nEWs • May 2014 51 sELf-sTudy sERiEs • Ensuring quality improvement becomes the accepted environment. • Increasing reliability. • Reducing costs by removing waste and rework. • Identifying and establishing continuous improvement techniques. • Conducting more efficient and focused meetings. • Increasing Customer loyalty. Quality management systems are no longer luxuries reserved for large academic healthcare campuses with deep resources. Central service departments of all shapes and sizes are increasingly moving toward some variation of quality improvement with a vision for implementing a QMS. It is time to build your quality tool box and add a few simple basic tools to assist your team’s success. These tools are to be shared and transparent. Through the eyes of Ishikawa, all employees play a greater role in total quality when taught to fish; doing so plans for the future and we all succeed through succession of our future leaders. HPn Sponsored by Richard Schule, MBA, BS, CST, FAST, CRCST, CHMMC, CIS, CHL, FCS, AGTS is the Director of Clinical Education and Co-chair of STERIS University at STERIS Corporation. In this role, he is responsible for a team of experienced clinical professionals and a portfolio of surgical and sterile processing continuing education and in-service programs for healthcare providers. He has extensive experience at standardizing and rebuilding educational programs for sterile processing staff at hospitals to help them achieve national certification. He has also assisted with the writing and implementation of equipment work instructions, department policies, procedures and guidelines supporting an ISO quality management system for sterile processing. Schule holds a Bachelor of Science degree in healthcare management from Southern Illinois University and a Master of Business Administration from the University of Phoenix. He is a member of the Association for the Advancement of Medical Instrumenta- tion (AAMI), the Association for periOperative Registered Nurses (AORN), the Association for Professionals in Infection Control and Epidemiology (APIC), the American Society for Quality (ASQ), the Association of Surgical Technologists (AST), the Society of Gastroenterology Nurses and Associates (SGNA), and the International Association of Healthcare Central Service Materiel Management (IAHCSMM). References 1. ANSI/AAMI/ISO 14937:2009/(R) 2013. Sterilization of health care products - General requirements for characterization of a sterilizing agent and the development, validation and routine control of a sterilization process for medical devices. 2. Bauer, J.E., Duffy, G.L., Westcott, R.T., - The Quality Improvement Handbook, 2nd Edition. ASQ Quality Press, Milwaukee, WI 2006. 3. International Standard ISO 13485 Medical devices – Quality management systems – Requirements for regulatory purposes, Second edition 2003-07-15 4. Juran, J. M., De Feo, J.A. – Juran’s Quality Handbook – The Complete Guide to Performance Excellence, 6th Edition. McGrawHill New York NY 2010. Our continuing education continues online... HEALTHCARE PuRCHAsing EWs n Our online Self-Study Series archive has 5 years of CEUs — all accredited by CBSPD. Visit www.hpnonline.com/ce sELf-sTudy sERiEs Sponsored by CONTINUING EDUCATION TEST • MAY 2014 Quality tools help CS follow equipment and product specifications Circle the one correct answer: 1. The seven basic quality tools include all except? A. Cause-and-effect diagram B. Check sheet C. Control charts D. History lessons E. Pareto chart F. Scatter diagram G. Stratification 2. Checklists are the same as check sheets? A. True B. False 3. Another name for a defect concentration diagram is? A. Control chart B. Cause-and-effect diagram C. Scatter diagram D. Check sheet 4. Who is credited with developing the cause-andeffect diagram? A. Kaoru Ishikawa B. Edward Deming C. Joseph Juran D. Walter Shewhart 5. When to use a check sheet? A. When data can be observed and collected repeatedly by the same person B. When collecting data on the frequency or patterns of defects C. When collecting data from a production process D. All the above 6. Creating a check sheet, how many defects can be tracked at one time? A. Five B. Eight C. Ten D. Twelve 7. Which ISO document supports quality tools? A. ISO 14385 B. ISO 12345 C. ISO 13485 D. ISO 17665-3 8. Kaoru Ishikawa believed only quality professionals played a greater role in quality improvement? A. True B. False 9. Another name for the cause-and-effect diagram? A. Fishbone Diagram B. Pareto Diagram C. Root cause analysis D. Ishikawa Diagram E. Both A and D 10. What are the benefits when basic quality tools are implemented? A. Reduced defects B. Improving product quality C. Reducing costs by removing waste and rework D. Ensuring quality improvements become the accepted environment E. All the above CONTINUING EDUCATION TEST • MAY 2014 Presented by Request for Scoring I have enclosed the scoring fee of $10 for EACH test taken. (Payable to KSR Publishing, Inc. We regret that no refunds can be given. Multiple submissions may be submitted in bulk and paid with a single check for the bulk sum.) Detach exam and return to: Continuing Education Division KSR Publishing, Inc. 2477 Stickney Point Road, Suite 315B Sarasota, FL 34231 PH: 941-927-9345 Fax: 941-927-9588 Sponsored by Please print or type. Return this page only. Name Title Hospital Name Mailing Address Apt/Suite City, State, Zip Daytime Phone E-mail www.hpnonline.com • HEALTHCARE PuRCHAsing nEWs • May 2014 53
