Experiment 3
advertisement
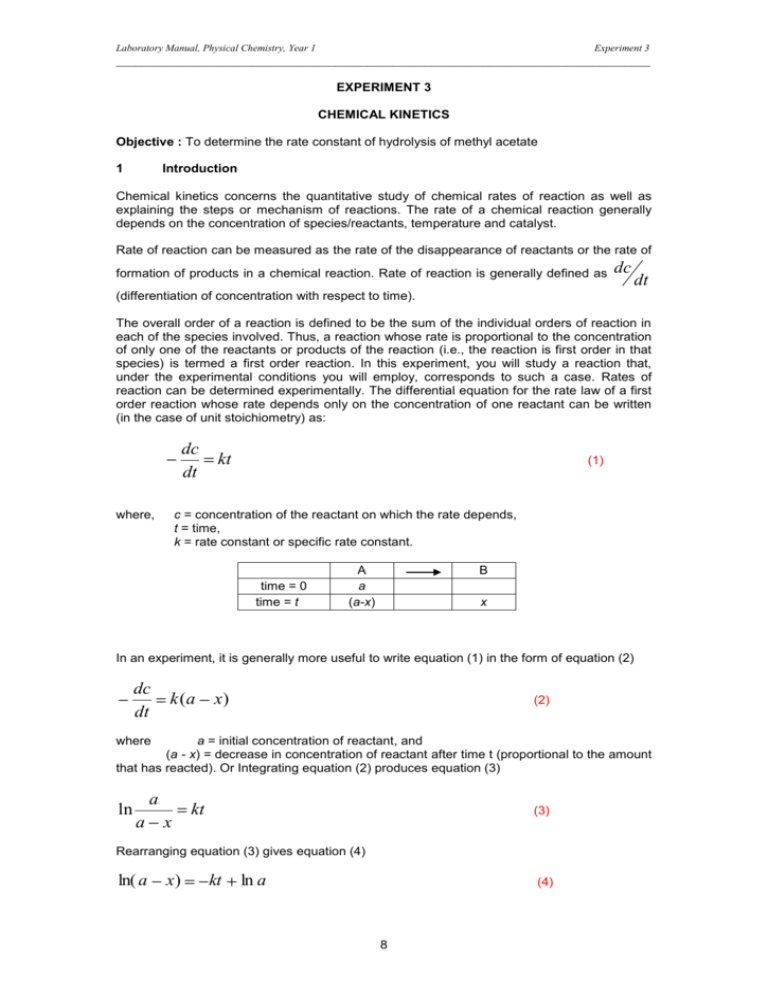
Laboratory Manual, Physical Chemistry, Year 1 Experiment 3 ___________________________________________________________________________________ EXPERIMENT 3 CHEMICAL KINETICS Objective : To determine the rate constant of hydrolysis of methyl acetate 1 Introduction Chemical kinetics concerns the quantitative study of chemical rates of reaction as well as explaining the steps or mechanism of reactions. The rate of a chemical reaction generally depends on the concentration of species/reactants, temperature and catalyst. Rate of reaction can be measured as the rate of the disappearance of reactants or the rate of formation of products in a chemical reaction. Rate of reaction is generally defined as dc dt (differentiation of concentration with respect to time). The overall order of a reaction is defined to be the sum of the individual orders of reaction in each of the species involved. Thus, a reaction whose rate is proportional to the concentration of only one of the reactants or products of the reaction (i.e., the reaction is first order in that species) is termed a first order reaction. In this experiment, you will study a reaction that, under the experimental conditions you will employ, corresponds to such a case. Rates of reaction can be determined experimentally. The differential equation for the rate law of a first order reaction whose rate depends only on the concentration of one reactant can be written (in the case of unit stoichiometry) as: dc dt where, kt (1) c = concentration of the reactant on which the rate depends, t = time, k = rate constant or specific rate constant. time = 0 time = t A a (a-x) B x In an experiment, it is generally more useful to write equation (1) in the form of equation (2) dc dt k (a x) (2) where a = initial concentration of reactant, and (a - x) = decrease in concentration of reactant after time t (proportional to the amount that has reacted). Or Integrating equation (2) produces equation (3) ln a a x kt (3) Rearranging equation (3) gives equation (4) ln( a x) kt ln a (4) 8 Laboratory Manual, Physical Chemistry, Year 1 Experiment 3 ___________________________________________________________________________________ Therefore, for a first order reaction, a graph of ln (a - x) versus t is a straight line with gradient, -k. Quantities that are proportional to concentration can be used instead as replacement for concentration in the above equations. In 1889 Arrhenius found that the values of rate constants increase exponentially with temperature. The relationship between rate constant and temperature is given by the Arrhenius equation: k A exp Ea RT (5) where, A = pre-exponential factor, and Ea = activation energy of the reaction For more precise rate data, experiment can be repeated with careful temperature control. Determination of the rate constant of hydrolysis of methyl acetate with HCl 0.5 M as catalyst Theory When esters such as methyl acetate react with water, some are converted to alcohol and acid, and the reaction can be explained as; CH3COOCH3 + H2O CH3COOH + CH3OH (6) This is a reversible reaction, but with the presence of excess water, this reaction can be considered as a complete reaction. Hydrolysis occurs slowly in pure water, with acid as catalyst. If this reaction is conducted in a dilute solution with the presence of a known concentration of strong acid, the rate and order of the reaction depends only on the concentration of methyl acetate. This is thought to be due to the concentration of water which is considered to be constant throughout the experiment and the concentration of acid does not change. The rate of reaction, however, is proportional to the concentration of acid. 2 Materials Apparatus: Conical flasks, burette, pipette, stop watch, water bath. Chemicals: Methyl acetate, 0.5 M of HCl, 0.1 M of NaOH and phenolphthalein indicator. (These solutions are prepared). 3. Experimental Procedure 1. Transfer 100 mL of 0.5 M HCl into a conical flask with a stopper and place the flask in the water bath. 2. Place another conical flask or bottle that contains methyl acetate in the same water bath. 3. While the temperature of these chemicals equilibrates, prepare a burette filled with 0.1 M NaOH solution. 4. Record the temperature of the water bath at an interval of 15 minutes. 5. When the temperature of the chemicals is in equilibrium with the temperatures of the water bath (after ≈ 10 minutes), pipette 5 ml of methyl acetate into the conical flask that contains the acid. Record the time of mixing as the initial time for the reaction (to) in measuring the reaction time (t). Shake the conical flask well and do not remove it from the water bath. 9 Laboratory Manual, Physical Chemistry, Year 1 Experiment 3 ___________________________________________________________________________________ 6. Use a pipette to immediately transfer 5 mL of the mixture into a 250 mL conical flask that contains 25 ml of icy water. Record the time as the time of reaction, t. In this case, t is equal to 0 minutes. 7. The acid/methyl acetate solution (in which reaction has been stopped) is then quickly titrated with 0.1 M NaOH using phenolphthalein as the indicator. (Make sure the solution is cold during titration). 8. Take titre readings for consecutive 5 mL solution mixtures that have reacted in the following time intervals: 10, 20, 30, 45, 60 and 80 minutes. Follow the same procedures as above (steps 6 and 7). 9. Make sure the time the reaction is stopped is recorded for every consecutive 5 mL mixture taken from the source mixture. 10. Finally, heat the remaining mixture for about 10 minutes until it boils to complete the reaction. Cool it down and titrate the solution twice. 4 Calculations The difference (V∞ – Vt) is proportional to the concentration of ester left (unhydrolysed) at time t, where Vt is the volume of NaOH required in titration (for the mixture that had reacted in time t) and V∞ is the volume of NaOH required for the mixture that completed the reaction (boiled). A plot of ln(V∞ – Vt) versus t will give a straight line with a gradient of -k. 5 References th 1. Mahan, B.H. (1987). University Chemistry, 4 edn. Addison-Wesley. th 2. Finlay, A. (1954). Practical Physical Chemistry, 8 edn. Longmans. nb: Please quote experimental error estimates for all your data presented. Plagiarism Warning! Some of these experiments are carried out in groups of usually a pair of students. Therefore expectedly, each member of a group followed an identical procedure in the laboratory and has the same set of raw data. Members of a group are allowed to discuss the analysis of data with one another. However, preparation of the report including data analysis, interpretation and discussion must be prepared by the individual student submitting the report. The Department does not tolerate plagiarized report! 10
