extension of the unified glare rating formula for non
advertisement
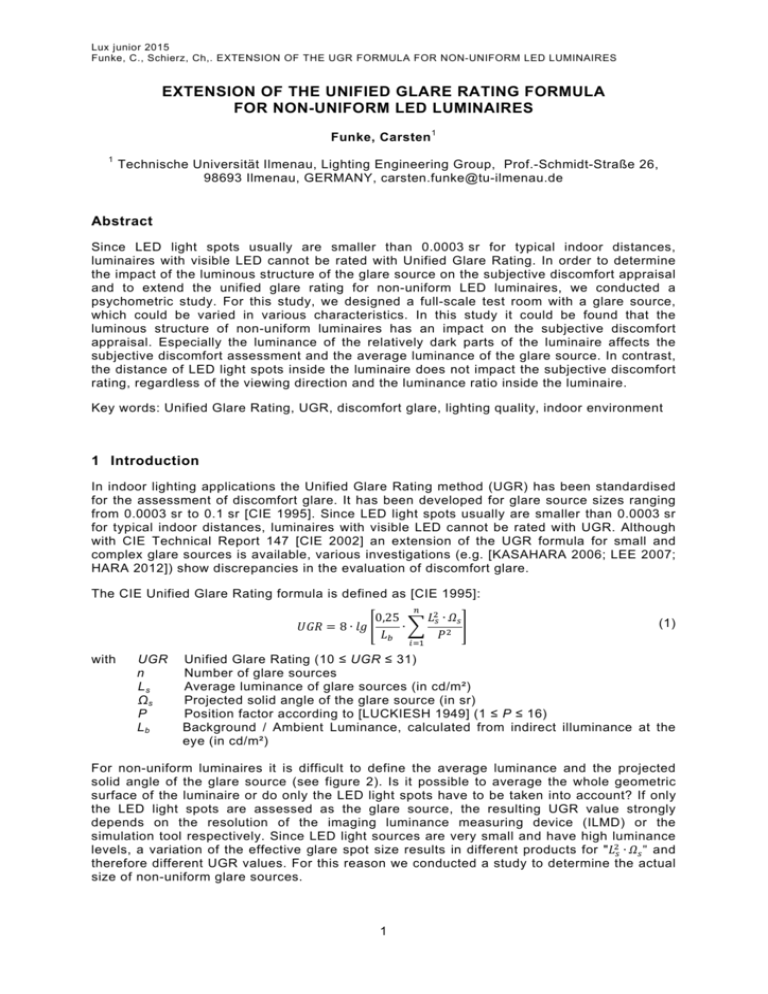
Lux junior 2015 Funke, C., Schierz, Ch,. EXTENSION OF THE UGR FORMULA FOR NON-UNIFORM LED LUMINAIRES EXTENSION OF THE UNIFIED GLARE RATING FORMULA FOR NON-UNIFORM LED LUMINAIRES Funke, Carsten 1 1 Technische Universität Ilmenau, Lighting Engineering Group, Prof.-Schmidt-Straße 26, 98693 Ilmenau, GERMANY, carsten.funke@tu-ilmenau.de Abstract Since LED light spots usually are smaller than 0.0003 sr for typical indoor distances, luminaires with visible LED cannot be rated with Unified Glare Rating. In order to determine the impact of the luminous structure of the glare source on the subjective discomfort appraisal and to extend the unified glare rating for non-uniform LED luminaires, we conducted a psychometric study. For this study, we designed a full-scale test room with a glare source, which could be varied in various characteristics. In this study it could be found that the luminous structure of non-uniform luminaires has an impact on the subjective discomfort appraisal. Especially the luminance of the relatively dark parts of the luminaire affects the subjective discomfort assessment and the average luminance of the glare source. In contrast, the distance of LED light spots inside the luminaire does not impact the subjective discomfort rating, regardless of the viewing direction and the luminance ratio inside the luminaire. Key words: Unified Glare Rating, UGR, discomfort glare, lighting quality, indoor environment 1 Introduction In indoor lighting applications the Unified Glare Rating method (UGR) has been standardised for the assessment of discomfort glare. It has been developed for glare source sizes ranging from 0.0003 sr to 0.1 sr [CIE 1995]. Since LED light spots usually are smaller than 0.0003 sr for typical indoor distances, luminaires with visible LED cannot be rated with UGR. Although with CIE Technical Report 147 [CIE 2002] an extension of the UGR formula for small and complex glare sources is available, various investigations (e.g. [KASAHARA 2006; LEE 2007; HARA 2012]) show discrepancies in the evaluation of discomfort glare. The CIE Unified Glare Rating formula is defined as [CIE 1995]: 8∙ with UGR n Ls Ωs P Lb 0,25 ∙ ∙ (1) Unified Glare Rating (10 ≤ UGR ≤ 31) Number of glare sources Average luminance of glare sources (in cd/m²) Projected solid angle of the glare source (in sr) Position factor according to [LUCKIESH 1949] (1 ≤ P ≤ 16) Background / Ambient Luminance, calculated from indirect illuminance at the eye (in cd/m²) For non-uniform luminaires it is difficult to define the average luminance and the projected solid angle of the glare source (see figure 2). Is it possible to average the whole geometric surface of the luminaire or do only the LED light spots have to be taken into account? If only the LED light spots are assessed as the glare source, the resulting UGR value strongly depends on the resolution of the imaging luminance measuring device (ILMD) or the simulation tool respectively. Since LED light sources are very small and have high luminance levels, a variation of the effective glare spot size results in different products for " ∙ " and therefore different UGR values. For this reason we conducted a study to determine the actual size of non-uniform glare sources. 1 Lux junior 2015 Funke, C., Schierz, Ch,. EXTENSION OF THE UGR FORMULA FOR NON-UNIFORM LED LUMINAIRES Figure 1 – Scene with a uniform LED source Figure 2 – Scene with a non-uniform LED source 2 Investigation method In order to determine the impact of the luminous structure of the glare source on the subjective discomfort appraisal, we conducted an extensive psychometric study at the TU Ilmenau. For this study, we designed a full-scale test room with a 0.6 m x 0.6 m recessed glare source in the ceiling, which could be varied in the following parameters: luminance and luminous flux of the visible LED number and distance of the visible LED luminance of the immediate vicinity of the LED size of the homogeneous lighting immediate vicinity For the variation of the aspects above we have chosen a layout, which was adapted from Eberbach [EBERBACH 1974], who used it for mesopic lighting studies (see figure 3). By comparing the results of series 1 and 2, it is possible to test the summation of LED light sources for discomfort glare. Pattern number 5 represents the uniform glare source at different luminance levels. The comparison of the results within series 3 shows the impact of the LED spot distance inside a luminaire. By means of the fourth series the influence of the homogeneous lighting immediate vicinity shall be investigated. 2. Series 1. Series 1 2 3 4 5 17 x 17 50 x 50 117 x 117 185 x 185 600 x 600 1 6 7 8 5 2 17 x 17 6 50 x 50 9 117 x 117 185 x 185 4. Series 3. Series 10 50 x 50 50 x 50 50 x 50 11 12 6 50 x 50 50 x 50 50 x 50 50 x 50 600 x 600 Figure 3 – Luminance patterns of the glare source, sorted in four series. The shaded areas represent the “darker” parts and the white ones the “bright” parts of the glare source. All dimensions are in millimetres. 2 Lux junior 2015 Funke, C., Schierz, Ch,. EXTENSION OF THE UGR FORMULA FOR NON-UNIFORM LED LUMINAIRES The subjective discomfort assessment was done by the multiple criterion Söllner scale (see table 1). Table 1 – Multiple-criterion scale for the glare estimation (Söllner scale) Discomfort rating Criteria 6 Glare intolerable 5 Glare between disagreeable and intolerable 4 Glare disagreeable 3 Glare between noticeable and disagreeable 2 Glare noticeable 1 Glare between non-existent and noticeable 0 No glare 2.1 Test setup The study was conducted in an office-like test room (overall dimensions: 6.6 m x 3.5 m, height 2.8 m, see figure 4). In the ceiling of the room the variable glare source was installed. Additionally nine ambient light sources were positioned under the desk, invisible for the subject. 2.80 m Figure 4 – Position of the test person in the test room. The numbers 1 to 7 represent different tasks and viewing directions. All luminaires had a correlated colour temperature between 4000 K and 4500 K. The walls and the ceiling of the room were equipped colour neutral. The ambient light sources were controlled with DALI in order to maintain a fixed ambient luminance when the glare source was varied. The glare source with a nearly Lambertian light distribution was dimmed by pulse duration modulation (14-bit, PDM-frequency 750 Hz) and was water-cooled to ensure a precise luminance during the test. Each of the twelve patterns (see figure 3) was presented with various luminances for the “bright” and the “dark” parts of the glare source, altogether 71 light situations (see table 2). 3 Lux junior 2015 Funke, C., Schierz, Ch,. EXTENSION OF THE UGR FORMULA FOR NON-UNIFORM LED LUMINAIRES Table 2 – List of parameter values of the glare source. Ls luminance of the bright part; ωs solid angle of the bright part; φLED distance of the visible LED inside the glare sources (at pattern 6, 9 and 10); Ld luminance of the dark part. Luminance L s (cd/m²) Distance φ LED (°) Solid angle ωs (sr) Luminance L d (cd/m²) 800 (1 LED) 1.58*10 -5 0.0 80 8,000 (9 LED) 1.39*10 -4 1.0 400 (49 LED) 7.74*10 -4 2.9 800 (121 LED) 1.90*10 -3 4.8 4,000 (homogenous) 2.20*10 -2 80,000 400,000 8,000 2.2 Test procedure All 71 light situations have been presented at seven different tasks and viewing directions, respectively (for details, see figure 4 and table 3). The main visual task during the test was a concentration performance test, in other words a moderate math task, which was presented on a computer screen in front of the subject. To solve the task, the subject needed to coordinate the following activities [BRICKENKAMP 2002, p. 286]: grasping, calculating, memorising, imaging and deciding. Thus the concentration performance test represented office task quite enough and it kept the subject focused at the computer screen. In addition to the visual math tasks, an aural math task was done to roughly simulate a telephone interview. After 15 seconds to complete the task, the subject stated the calculation result and his discomfort glare rating. In order to consider the task difficulty, also an easy task (point fixation) was presented. Task 1 and task 4 were repeated once after six months to check the repeatability of the glare estimations. The ambient luminance was changed by using curtains and carpets with different reflectances. In total 19,170 glare assessments have been performed. Table 3 – List of tasks, viewing directions and ambient luminances Task number Task time for task θ (angle to glare source) Ambient luminance L b 1 Math task 15 s 30° 42 cd/m² 2 Math task 15 s 30° 190 cd/m² 3 Aural math task 15 s free view 42 cd/m² 4 Math task 15 s 15° 42 cd/m² 5 Math task 15 s 15° 190 cd/m² 6 Point fixation 7s 15° 42 cd/m² 7 Short gaze into glare source 7s 0° 42 cd/m² Each task was performed by 30 subjects (13 women, 17 men). Therefrom four were employees of the lighting engineering group at the TU Ilmenau (age ranging from 33 to 54 years). The other 26 subjects had no experience in lighting and were aged between 20 and 33 years (mean: 25.1 years). All test persons had a minimum visual acuity of 0.6 for near and far distances. During the test, the gaze direction was recorded by an eye tracking device (stereo camera system, see figure 5). Due to the eye tracking device, no people who wear glasses were allowed for the study. Eight subjects used contact lenses during the test. 4 Lux junior 2015 Funke, C., Schierz, Ch,. EXTENSION OF THE UGR FORMULA FOR NON-UNIFORM LED LUMINAIRES Figure 5 – Subject in test room during task 1. The subject firstly calculates the row results and secondly subtracts the smaller value from the bigger value. 3 Results 3.1 Influence of the distance of LED light spots on discomfort glare In order to systematically check the influence of the LED distance inside a luminaire on discomfort glare, we presented nine LED light spots at four LED distances (φ LED = 0° to 4.8°), four LED luminances (L h = 800 cd/m² to 400,000 cd/m²) and three luminance ratios (L h / L d = 10…100…1,000) to all subjects at all tasks. Figure 6 shows the discomfort glare ratings at task 1 for LED luminances of 80,000 cd/m² and different luminance ratios L h / L d . In this figure one can see, that at every luminance level of the dark parts the glare rating keeps constant, whereas the glare rating increases for rising luminance levels of the dark parts. In other words, the distance of LED light spots inside LED luminaires has no significant effect on the discomfort glare rating for this lighting situation, even if there is no distance anymore. Figure 6 – Influence of the distance of LED light spots for 9 LED. LED luminance Lh = 80,000 cd/m². Angle to glare source θ = 30°, ambient luminance Lb = 42 cd/m² (task 1). 5 Lux junior 2015 Funke, C., Schierz, Ch,. EXTENSION OF THE UGR FORMULA FOR NON-UNIFORM LED LUMINAIRES The same relationship had been observed for all LED luminances at all tasks, even if the subject was looking right into the glare source. Therefore, the distance of LED light spots inside LED luminaires does not affect discomfort glare. In contrast, the surrounding background of LED luminaires has a negative influence on discomfort glare ratings even at low luminance levels (e.g. L d = 800 cd/m² in figure 6). 3.2 Additivity of LED light spots for discomfort glare As a result of figure 6, also the additivity of LED light spots on discomfort seems to be valid – at least for nine LED light spots. To prove this thesis even for more LED sources, we presented 49 LED and 121 LED light spots at four LED luminances (L h = 800 cd/m² to 400,000 cd/m²) and three luminance ratios (L h / L d = 10…100…1,000) to all subjects at all tasks. Figure 7 shows the discomfort glare ratings at task 1 for 49 LED light spots versus the equivalent continuous luminous area for different LED luminances and different luminance ratios L h / L d . By comparing pairwise the discomfort glare assessments on the left side of figure 7 with the right side of figure 7, it appears that there is no distinct difference between the glare assessments for several LED light spots and a single continuous luminous area. Likewise, we found the same relationship at all tasks and for 121 LED as well. Hence it is possible to sum up the luminous area of several LED light spots for indoor luminaires, irrespective of the luminance ratio inside the luminaire. We tested this for average LED luminances L h up to 80,000 cd/m². Figure 7 – Comparison of LED light spots to equivalent continuous area for 49 LED. Angle between line of sight and glare source θ = 30°, ambient luminance Lb = 42 cd/m² (task 1). 3.3 Discomfort glare rating for non-uniform LED luminaires The CIE report no. 117 [CIE 1995, p. 25ff.] proposes methods to determine the luminous part of the luminaire. For non-uniform LED luminaires, there is no information provided. Therefore we used a different method to identify the glaring parts of the luminaire. This method was presented in 2003 and was originally developed to measure UGR values for luminaires with fluorescent and incandescent lamps, using a rotating ILMD top-mounted on a servo unit [WOLF 2003]. In our study, we mounted an ILMD equipped with 1.3 megapixel MP plus fisheye lens at the subject’s position and used the algorithm described in [WOLF 2004] to calculate UGR values. Before the UGR values can be calculated, the threshold luminance of the glare sources must be derived from the luminance picture. Therefore the local contrasts firstly are calculated: 6 Lux junior 2015 Funke, C., Schierz, Ch,. EXTENSION OF THE UGR FORMULA FOR NON-UNIFORM LED LUMINAIRES (2) , , , (3) , , (4) , , If the threshold , is greater than or equal to 0.25, the value , is not considered for the next steps and is not included in the filtered histogram (see figure 9). Secondly the resulting histogram is smoothed according to equation (5). The threshold limit 0.25 and the parameter g of the smoothing algorithm both are empirical values, determined in [WOLF 2004]. ∗ 1 2∗ 1 ∗ ∗ 7 Figure 8 – Luminance picture of test room (5) (6) Figure 9 – Luminance histogram (at the top) and filtered luminance histogram (at the bottom) With the smoothed histogram it is possible to determine the threshold luminance at the first local minimum right to the global maximum of the smoothed histogram (see figure 9). This criterion also works in rooms with several luminaires as described [WOLF 2004]. The threshold luminance is calculated based on the actual physiologic values and therefore the size of glare source does not change enormously when the ambient luminance changes or the ILMD has a different resolution. For all available data of our study and the parameters mentioned above, the threshold luminances range from 120 cd/m² to 600 cd/m². The third step is to identify the glare sources in the visual field with the computed threshold luminance criterion. All contiguous glaring pixels are treated as one glare source and according to equation (1) the average luminance, the solid angle and the position factor are calculated. From those pixels, whose luminance values are smaller than the threshold luminance, the ambient luminance is computed by weighting the pixel luminances with their 7 Lux junior 2015 Funke, C., Schierz, Ch,. EXTENSION OF THE UGR FORMULA FOR NON-UNIFORM LED LUMINAIRES respective solid angles. Figure 12 shows the results of the algorithm plotted against the mean values of the 30 subjects (with respective standard error) and the best-fit line for every task. Figure 10 – Luminance picture of test room Figure 11 – Filtered luminance histogram (at the top) and smoothed luminance histogram with threshold (at the bottom) Figure 12 – Discomfort glare ratings (means and standard errors) against calculated UGR values with the computation method according to [WOLF 2004] 8 Lux junior 2015 Funke, C., Schierz, Ch,. EXTENSION OF THE UGR FORMULA FOR NON-UNIFORM LED LUMINAIRES 4 Discussion In figure 12 it appears that the computed algorithm is appropriate to assess discomfort glare indoor environments, because the best-fit lines are very close and have high coefficients of determination (R² > 0.8). Nevertheless, the theoretical curve from Söllner [CIE 1983] is considerably below the curves of the present study. One reason for the differences may be associated with the study design. We used only one glare source and controlled the ambient luminance with invisible luminaires in contrast to Söllner, whose ambient luminance was connected to the luminous flux of the glare sources. Besides we are planning to compare the data with newer studies (e.g. [KASAHARA 2006; LEE 2007; HARA 2012]), but because of the different glare assessment scales, an adequate comparison is not available at the moment. Additionally, we investigated the influence of threshold luminance on the discomfort computed UGR values. As proposed in [CIE 1995], we tested 500 cd/m² and 1000 cd/m² (see figure 13) as threshold luminances and it seems that the resulting differences for our parameters and discomfort data are relatively small. Anyway, from our point of view, the algorithm described above is expected to be more realistic due to its adaption on the actual lighting situation. In the future, the influence of the measurement resolution on the calculated UGR values shall be investigated. Figure 13 – Discomfort glare ratings (means and standard errors) against calculated UGR values with fix threshold of 500 cd/m² References CIE 1983. CIE 55:1983. Disomfort Glare in the Interior Working Environment. Paris: CIE. CIE 1995. CIE 117:1995. Discomfort Glare in Interior Lighting. Vienna: CIE. CIE 2002. CIE 146+147:2002. CIE collection on glare. Vienna : CIE. 9 Lux junior 2015 Funke, C., Schierz, Ch,. EXTENSION OF THE UGR FORMULA FOR NON-UNIFORM LED LUMINAIRES HARA, N.; HASEGAWA, S. 2012. Study on Discomfort Glare Rating on the Luminaire with LED Array. In: Journal of Illuminating Engineering Institute Japan 96 (2), p. 81–88. LEE, Ch.-M.; KIM, H.; CHOI, D.-S. 2007. A Study on the Estimation of Discomfort Glare for LED Luminaires. In: CIE (ed.): Proceedings of the 26th CIE Congress 2007. Proceedings of the 26th CIE Congress 2007. Beijing, China, 04. to 07. july 2007. CIE, p. D3-33 - D3-36. KASAHARA, T. et al. 2006. Discomfort Glare Caused by White LED Light Sources. In: Journal of Light and Visual Environment 30 (2), p. 49–57. LUCKIESH, M. and GUTH, S. K. 1949. Brightness in the visual field and the border of comfort and discomfort (BCD). Illuminating Engineering, 44, p. 650-670. EBERBACH, K. 1974. Der Einfluss der Leuchtdichtestruktur von Lichtquellen auf die Blendempfindung. Lichttechnik 6, p. 283–286. BRICKENKAMP, R.; BRÄHLER, E.; HOLLING, H. 2002. Brickenkamp Handbuch psychologischer und pädagogischer Tests, 3rd edition, Göttingen: Hogrefe Verlag. WOLF, S.; GALL, D. 2003. Luminance Analyses - What they are and how do they work. 25th Session of the CIE, San Diego, 25 th June to 2 nd July 2003, Proceedings D2, p.66-69. WOLF, S. 2004. Entwicklung und Aufbau eines Leuchtdichte-Analysators zur Messung von Blendungskennzahlen. PhD thesis, publication series of the Lighting Engineering Group of the Technische Universität Ilmenau, Nr. 7, Der Andere Verlag Osnabrück, ISBN 3-89959-280-8. 10


