from absorbance and concentration data
advertisement
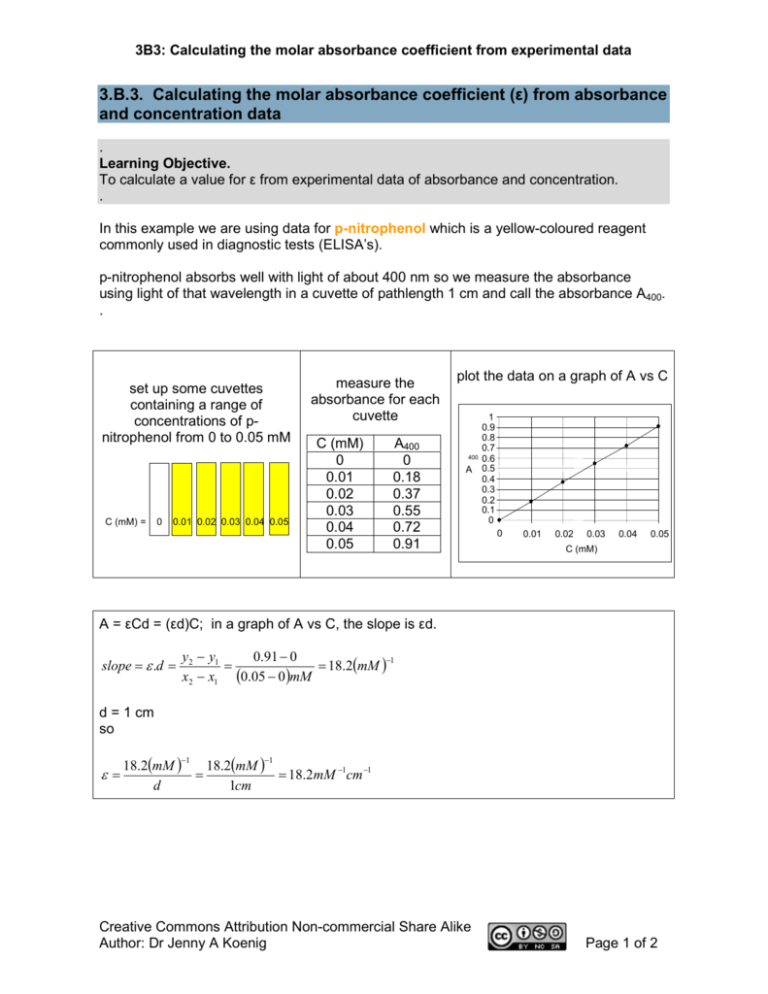
3B3: Calculating the molar absorbance coefficient from experimental data 3.B.3. Calculating the molar absorbance coefficient (ε) from absorbance and concentration data . Learning Objective. To calculate a value for ε from experimental data of absorbance and concentration. . In this example we are using data for p-nitrophenol which is a yellow-coloured reagent commonly used in diagnostic tests (ELISA’s). p-nitrophenol absorbs well with light of about 400 nm so we measure the absorbance using light of that wavelength in a cuvette of pathlength 1 cm and call the absorbance A400. . set up some cuvettes containing a range of concentrations of pnitrophenol from 0 to 0.05 mM C (mM) = 0 0.01 0.02 0.03 0.04 0.05 measure the absorbance for each cuvette C (mM) 0 0.01 0.02 0.03 0.04 0.05 A400 0 0.18 0.37 0.55 0.72 0.91 plot the data on a graph of A vs C 400 A 1 0.9 0.8 0.7 0.6 0.5 0.4 0.3 0.2 0.1 0 0 0.01 0.02 0.03 0.04 0.05 C (mM) A = εCd = (εd)C; in a graph of A vs C, the slope is εd. slope = ε .d = y2 − y1 0.91 − 0 −1 = = 18.2(mM ) x2 − x1 (0.05 − 0 )mM d = 1 cm so 18.2(mM ) 18.2(mM ) = = 18.2mM −1cm −1 d 1cm −1 ε= −1 Creative Commons Attribution Non-commercial Share Alike Author: Dr Jenny A Koenig Page 1 of 2 3B3: Calculating the molar absorbance coefficient from experimental data However.... ε is usually written with the units M-1.cm-1. How do we get ε in the right units? Two possible methods: 1 Possibly the easiest way is to start with M rather than mM in the first place. εd = 0.91 − 0 = 18.2 10 −3 M (0.05 − 0) × 10 −3 M ( ) −1 = 18.2 × 10 3 M −1 = 18200 M −1 then ε = 18200 M-1 / 1 cm = 18200 M-1.cm-1 . 2 Another method is to say 1000 mM = 1 M, so 1000 mM.M-1 = 1 If ε = 18.2 mM-1.cm-1 then you can multiply both sides by 1 (=1000 mM.M-1) ε = 18.2 mM-1.cm-1 x 1000 mM.M-1 then the mM-1 cancels with the mM ε = 18.2 mM-1.cm-1 x 1000 mM.M-1 and you are left with ε = 18200 M-1cm-1 . Creative Commons Attribution Non-commercial Share Alike Author: Dr Jenny A Koenig Page 2 of 2
