design of optimum power estimator based on wiener model applied
advertisement
A. Huang, J. M. A. Tanskanen, and I. O. Hartimo, “Design of optimum power estimator based on Wiener model applied to mobile transmitter power control,” in Proc. of 1998 IEEE International Symposium on Circuits and Systems, Monterey, California, USA, May 1998, pp.
249–252.
DESIGN OF OPTIMUM POWER ESTIMATOR BASED ON WIENER MODEL
APPLIED TO MOBILE TRANSMITTER POWER CONTROL
A. Huang1,2, J. M. A. Tanskanen1, I. O. Hartimo1
1
Lab. of Signal Processing & Computer Tech.
IRC, Helsinki Univ. of Tech.
P.O.Box 3000, FIN-02015 HUT, Finland
ABSTRACT
Estimation of signal power/instantaneous energy requires nonlinear systems. A power estimator based on the Wiener model is proposed in this paper. Its input signal can be complex-valued, e.g., a
baseband signal in a communications system, and its output is
guaranteed to be positive. It is computationally very efficient as
compared to quadratic filters, and allows for a predescribed prediction step required, for example, for application in delay sensitive closed control loops. Two methods of optimum/partial-optimum design are presented. The partially-optimized power estimator is simulated in COSSAP environment as a part of the power
control loop of a CDMA mobile radio communication system. The
system performance improvements are observed from bit error rate
reductions.
1. INTRODUCTION
Power (instantaneous energy) of a signal is defined as the square
of the signal magnitude, i.e., |x(t)|2 at a continuous time instant t,
or |x(n)|2 at a discrete time instant n. A standard power estimator
for real-valued signals, which is also called standard energy detector, consists of a linear time invariant (LTI) filter followed by a
magnitude-square operation >1@. A more general power estimation
system for real-valued signals is referred to as quadratic filter (QF)
or a quadratic detector >1][2@. QF can provide better trade-off between different desired features >2@. However, the large processing
delay and the heavy computational requirements of quadratic filtering precludes its real-time use. Moreover, the resulting power
estimate is not guaranteed to be positive.
In engineering, computationally efficient power estimation of
complex-valued signals is often needed. For example, it is very
important to keep the signal powers received at a base station from
all the mobile users in a mobile CDMA radio communications
system at equal and constant level by controlling their transmitted
powers >3][4@. The powers of the received noisy baseband signals
should be measured, filtered and compared with a preset power
level threshold, so that power control can be realized by a control
loop, and the mutual interference between different users can be
reduced. The use of a predictive power estimator in the power
control loop has been suggested to improve the performance of
mobile radio communication systems >5][6@. The function of the
predictive power estimator is threefold: to reduce additive noise
and corrupting interference (i.e., filtering), to calculate the received signal power level which is affected by channel fading and
the distance between the mobile handset and the base station (i.e.,
measuring), and to predict the future value of the power of the received signal. Predictive power estimator reduces to power measurement if its filtering/prediction function is removed. The power
estimator has to be computationally efficient to be applied in real-
2
Inst. of Detection Tech. & Intelligent Instrument
Dept. of Scientific Instrument, Zhejiang Univ.
Hangzhou 310027, China
time control.
In this paper we propose a power estimator (PE) for complex-valued signals, with an application in the power control loop in
CDMA mobile radio systems. This PE has a structure based on the
Wiener model >1][2][7][8@ and it is thus computationally very efficient. It can be designed to be predictive. Also, the output is
guaranteed to be positive as required by the power estimation applications. In Section II, the structure is presented and discussed.
Two methods of optimum design are derived in Section III, and
the partially-optimized PE is demonstrated with a simple example.
The results of communication system simulations in COSSAP environment are given in Section IV. Section V concludes the paper.
2. POWER ESTIMATOR BASED ON
WIENER MODEL
The Wiener model (WM) consists of a FIR filter followed by a
squaring operation >1][2@. It has been called the standard energy
detector for real-valued signals because its structure reflects the
function of removing noise and then calculating signal power. It
can be viewed as a QF with a dyadic kernel, or a special case of
the Wiener system used for nonlinear system recognition
[1][2][7][8]. It is of practical interest due to its simple structure.
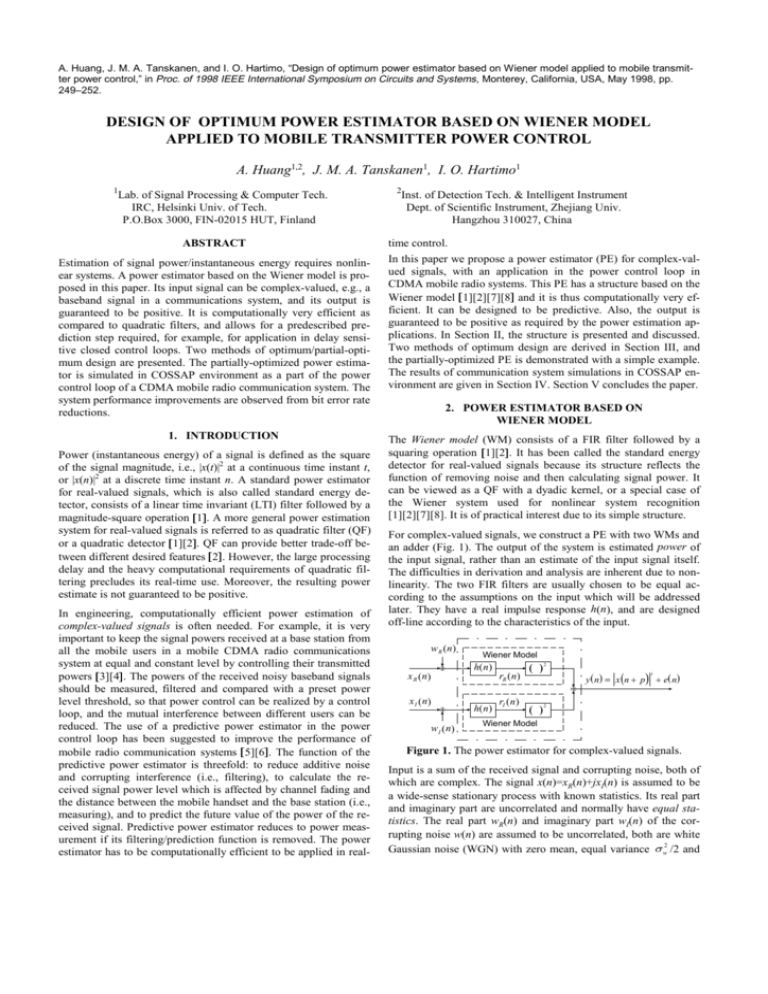
For complex-valued signals, we construct a PE with two WMs and
an adder (Fig. 1). The output of the system is estimated power of
the input signal, rather than an estimate of the input signal itself.
The difficulties in derivation and analysis are inherent due to nonlinearity. The two FIR filters are usually chosen to be equal according to the assumptions on the input which will be addressed
later. They have a real impulse response h(n), and are designed
off-line according to the characteristics of the input.
w R (n )
Wiener Model
h( n)
rR ( n)
x R ( n)
x I ( n)
w I ( n)
h( n )
rI ( n)
2
2
y n
x n p e n 2
Wiener Model
Figure 1. The power estimator for complex-valued signals.
Input is a sum of the received signal and corrupting noise, both of
which are complex. The signal x(n)=xR(n)+jxI(n) is assumed to be
a wide-sense stationary process with known statistics. Its real part
and imaginary part are uncorrelated and normally have equal statistics. The real part wR(n) and imaginary part wI(n) of the corrupting noise w(n) are assumed to be uncorrelated, both are white
Gaussian noise (WGN) with zero mean, equal variance V w2 /2 and
A. Huang, J. M. A. Tanskanen, and I. O. Hartimo, “Design of optimum power estimator based on Wiener model applied to mobile transmitter power control,” in Proc. of 1998 IEEE International Symposium on Circuits and Systems, Monterey, California, USA, May 1998, pp. 249–
252.
kurtosis 3 V w4 /4 [9]. Hence, w(n) is an additive WGN process with
zero mean, variance V w2 and kurtosis 2 V w4 (see Appendix 1). For
the optimum PE formulation, we define input signal-to-noise ratio
(SNR) as the ratio of average powers of input signal and corrupting noise
J
E{| x ( n )| 2 } E{| w( n )| 2 }
Rx ( 0 ) V w2
(1)
where E{.} denotes the expectation, Rx(l) is the autocorrelation
function whose value at the origin is the average power Rx(0) of
the signal.
The output y(n)=|x(n+p)|2+e(n) is an estimate of the signal power
|x(n)|2= x R2 n x I2 n with a prediction step p. The value of p can
be any integer depending on the underlying application. For instance, p>0 refers to a p-step-ahead power prediction. The mean
value of the desired output |x(n+p)|2 can be obtained according to
the stationary characteristics of x(n), as
E{| x ( n p )| 2 }
E{| x ( n )| 2 }
Rx ( 0) .
(2)
The output y(n) can also be expressed in terms of the filtered input
r(n) as
y ( n ) | r ( n )| 2
r ( n )r * ( n )
h T ( x w )( x w ) *T h
(3)
T
where r(n) = rR(n)+jrI(n) = h (x+w) with the length-N filter impulse response vector h = >h(0) ... h(N-1)@T, the signal vector x =
>x(n) ... x(n-N+1)@T, and the noise vector w = >w(n) ... w(n-N+1)@T,
the superscript “*” denotes complex conjugate, and “T” denotes
transpose. y(n) is always positive due to the squaring operation.
The real-valued power estimation error is defined as the difference
between the practical output and the desired output
e( n )
y ( n )| x ( n p )|
r ( n )r * ( n ) x ( n p ) x * ( n p ) . (4)
2
This error consists of the second-order terms x2(n) and w2(n), as
well as the cross term of x(n) and w(n). That is, this error is both
signal-dependent and noise-dependent after the nonlinear operation. The estimation bias, i.e., the mean of e(n), can be derived as
Bias
E{e( n )}
h Rxh T
2
Vw
G n Rx (0)
(5)
T
where Rx = E{xx* } is the autocorrelation matrix of the signal,
and Gn=hTh is the noise gain of the filter. This bias is unavoidable
because of the existence of the second-order terms in the expression of e(n). The estimation variance, i.e., mean squared error
(MSE), can be expressed as
E{e 2 ( n )} E{ y 2 ( n )} 2 E{ y ( n )| x( n p )| 2 } E{| x ( n p )| 4 } . (6)
In the following text, both the terms “MSE” and “variance” are
used depending on the context.
3. OPTIMUM DESIGN
There are two methods to optimize the PE based on WM, as derived in the following.
3.1 Global Optimization and Numerical Solution
The global optimization is performed to design the FIR filters to
minimize the MSE E{e2(n)} at the output of the PE. Taking the
partial derivative of (6) with respect to h yields (see Appendix 2)
w E{e 2 ( n )}
wh
^
`
^
`
2 E S S * hh T S h 2 E x n p S S * h (7)
2
where S = (x+w)(x+w)*T is an NuN Hermitian matrix. Noting that
h is a non-zero vector, we set the partial derivative in (7) to zero,
eliminate h from both terms, and obtain
E{(S S*)h G h TG S}
E{| x ( n p )| 2 (S S*)}
(8)
where the subscript “G” denotes global optimization. Equation (8)
can not be further simplified due to the existence of the expectations. It provides an implicit expression for iteratively calculating
the optimal filter impulse response hG for a globally-optimized PE.
However, the numerical calculations could be massive and possess
some uncertainty in the obtained hG, and also convergence is not
guaranteed.
3.2 Partial Optimization and Analytical Solution
As the globally-optimal solution is difficult to obtain, we turn to
seek a partially-optimal solution. Let the filtered input signal in
Fig. 1 be expressed as r(n)=x(n+p)+H(n) where H(n)=HR(n)+jHI(n)
is the estimation error at the output of the FIR filters (Fig. 2). The
goal is to minimize the MSE E{|H(n)|2} = E{H 2R (n)} + E{H 2I (n)}
so that an optimal estimate of the delayed signal is achieved at the
output of the filters, and the MSE E{e2(n)} at the PE output is in
turn reduced. That is, the overall PE is to be partially optimized.
w R ( n)
Wiener Model
h( n )
rR n x R ( n)
x R n p H R n
2
Figure 2. The Wiener model processing the real part of the input.
First, the WM which processes the real part of the input (Fig. 2) is
considered. The optimal filter minimizing E{ H R2 (n)} is actually
the Wiener filter whose impulse response can be calculated from
the Wiener-Hopf equation [10] as
(9)
h opt R R1 r R
where RR=E{(xR+wR)(xR+wR)T} is an NuN auto-correlation matrix, rR=E{xR(n+p)>xR+wR@} is a cross-correlation vector, and xR
and wR are the real parts of x and w respectively. The optimal filter impulse response hopt is thus real-valued. Noting that wR(n) is
zero-mean WGN with a variance of V w2 /2, and that it is independent of xR(n), further derivation yields rR=E{xR(n+p)xR} and RR=
E{xRxRT}+ V w2 I/2. Letting rxR=E{xR(n+p)xR} and RxR= E{xRxRT},
the Wiener-Hopf equation can be further elaborated as
h opt
( R xR V w2 I 2) 1 r xR .
(10)
Correspondingly, the minimum MSE (MMSE) achieved at the
output of the Wiener filter is [10]
E{H R2 ( n )}min
T
h opt .
Rx (0 ) 2 rxR
(11)
Secondly, we consider the optimization of the WM which processes the imaginary part of the input. It has been assumed that the
real and the imaginary parts of the signal have equal statistics, and
so do the real and the imaginary parts of the noise. Therefore, the
optimal filter impulse response in this WM must be also hopt, and
the MMSE E{ H I2 (n)}min at the filter output equals to E{ H R2 (n)}min.
Hence, the partially-optimized PE consists of an adder and two
WMs with equal Wiener filters. The power estimation bias in (5)
A. Huang, J. M. A. Tanskanen, and I. O. Hartimo, “Design of optimum power estimator based on Wiener model applied to mobile transmitter power control,” in Proc. of 1998 IEEE International Symposium on Circuits and Systems, Monterey, California, USA, May 1998, pp. 249–
252.
can be expressed now in terms of the MMSE E{|H(n)|2}min at the
Wiener filters’ outputs as (see Appendix 3)
The variance in (6) can also be further derived, although its general expression is long and not given here.
A simple case is studied to illustrate the partial optimum solution.
The input signal is chosen to be a constant which is an approximation of narrow-band fading signals. We set x(n) = XR+jXI
=XR(1+j) to satisfy the assumption on equal statistics. Hence,
Rx(0)=2 X R2 , RxR= X R2 E and rxR= X R2 e. Here E is an NuN matrix
with all the elements of unity, and e is a length-N vector with all
the elements of unity. Substituting these into (10), the impulse response of the Wiener filter can be obtained in terms of the input
SNR and the filter length, as
be .
Bias min
V w2 b ,
(14)
and the variance can be derived from (6) as >6@
E{e 2 ( n )} min
V w J (1 2 NJ
4
2
2 N 2 J 2 2 N 3J 3 ) (1 NJ ) 4 .(15)
For the sake of performance comparison, conventional averagers
are employed since they have extremely narrow bandwidth and
thus are very efficient for removing noise from constant signals.
The impulse response of a conventional averager is have = e/N with
a constant coefficient value 1/N. When it is used to construct a PE
for a constant input signal in noise, the resulted power estimation
bias and variance can be derived from (5) and (6), respectively, as
>6 @
Bias ave
2
2
V w N , and E{e ( n )}ave
2V w4 (1 NJ ) N 2 . (16)
The comparison results are depicted in Figs. 3, 4, and 5. It is observed from (13) that the Wiener filter for a constant signal in
noise is a scaled averager which has as narrow bandwidth as that
of conventional averager with the same length. Hence, it is also
very efficient for noise reduction from constant signals. All the
coefficient values are equal to b which is a function of input SNR
and filter length. The maximum value of b is 1/N. As input SNR
decreases, b decreases whereas the coefficient value of conventional averager stays at 1/N (Fig. 3). This feature of the Wiener
filter reduces efficiently the power estimation bias and variance, as
seen from Figs. 4 and 5, or by comparing (14) and (15) with (16).
4. SYSTEM SIMULATIONS
To assess the applicability of the partially-optimized PE to the
power control in CDMA communication systems, a single-user
simulator with a closed power control loop is constructed in
COSSAP software environment. The system parameters are selected as carrier frequency 1.8 GHz, chip rate 1.2288 MHz, bit
rate 9600 Hz, control period 0.625 seconds, and single bit power
control command with r1 dB mobile transmitter power level
change step. These parameters are derived from those for the
Qualcomm CDMA system [11] except that the control rate
0.14
0.12
0.1
0.08
averager, N=21
0.04
Wiener filter, N=21
0.02
−10
−5
0
5
10
15
20
Input SNR (dB)
Figure 3. The Wiener filters’ coefficient values b for constant signals, and the coefficient values of averagers of the same lengths.
12
(13)
where the coefficient value b = J/(1+NJ). This closed-form expression can be used as a basis of the adaptive implementation of the
partially-optimized PE >6@. The corresponding power estimation
bias can be derived from (11) and (12) as
Wiener filter, N=5
0.16
0.06
(constant input signal with power of unity )
Power Estimation Variance
e J (1 NJ )
0.18
10
dash−dotted:
8
6
PE with averagers (N=5)
dotted:
PE with averagers (N=21)
solid:
partially−optimized PE (N=5)
dashed: partially−optimized PE (N=21)
4
2
0
−10
−8
−6
−4
−2
0
2
4
Input SNR (dB)
Figure 4. The estimation variances achieved by the PEs with
Wiener filters and the PEs with averagers.
2
(constant input signal with power of unity )
1.8
1.6
Power Estimation Bias
h opt
0.2
averager, N=5
(12)
Filter Coefficient Value
E{|H(n)|2}min = 2 E{ H R2 (n)}min.
Bias min
0.22
dash−dotted: PE with averagers (N=5)
1.4
solid:
partially−optimized PE (N=5), absolute value
1.2
dotted: PE with averagers (N=21)
1
dashed: partially−optimized PE (N=21), absolute value
0.8
0.6
0.4
0.2
0
−10
−8
−6
−4
−2
0
2
4
Input SNR (dB)
Figure 5. The biases achieved by the PEs with Wiener filters (the
absolute value of that in (16)) and by the PEs with averagers.
is doubled. To evaluate system performance, bit error rates (BERs)
are counted by comparing 100,000 bits of the received signal and
the transmitted signal. Two Rayleigh fading channels are employed with maximum Doppler shifts corresponding to mobile
speeds of 10 km/h and 30 km/h. Three power controllers are
tested: Controller 1 using a partially-optimized one-step-ahead
predictive PE (N=15), Controller 2 using a PE whose FIR filters
are first degree one-step-ahead Heinonen-Neuvo (H-N) polynomial predictors >12@ (N=15), and Controller 3 using power measurement (no filtering/prediction). The latter two controllers are
chosen for comparisons.
A. Huang, J. M. A. Tanskanen, and I. O. Hartimo, “Design of optimum power estimator based on Wiener model applied to mobile transmitter power control,” in Proc. of 1998 IEEE International Symposium on Circuits and Systems, Monterey, California, USA, May 1998, pp. 249–
252.
Some of the simulation results are listed in Table 1. When input
SNR is 0 dB, the BER obtained by using Controller 3 is as high as
0.1284 which is not acceptable. By using Controllers 1 and 2,
lower BERs are obtained as 0.0374 and 0.0524, respectively.
When input SNR is 10 dB, all the controllers are able to track the
actual fading channel, with a little different performances. When
input SNR is as high as 20 dB, the effect of background noise and
the interference on the received signal is very small and thus can
be omitted. Hence, the BERs obtained by using all the three Controllers are almost equal. Similar observations can be made in the
case of mobile speed 10 km/h. It is clearly seen that the controllers
with predictive PEs give better performances than the controller
with power measurement, especially when input SNR is low. The
improvements come from the noise reduction and prediction realized by the PEs. The controller employing the partially-optimized
predictive PE behaves even better than the controller using the PE
with H-N predictors.
Table 1. Bit error rates under mobile speed 30 km/h.
Input SNR
0 dB
10 dB
Controller 1
0.0374
0.0118
Controller 2
0.0524
0.0120
Controller 3
0.1284
0.0123
20 dB
0.0079
0.0079
0.0079
527, 1994.
Tanskanen J., Huang A., Laakso T. I., and Ovaska S. J.
“Prediction of received signal power in CDMA cellular
systems”. Proceedings of 45th IEEE Vehicular Technology
Conference, Chicago, IL, July 1995, pages 922-926.
>6@ Huang A. Efficient Methods for Power Estimation Optimization and Implementation. Licentiate Thesis, Helsinki
University of Technology, Espoo, Finland, 1996.
[7] Pitas I. and Venetsanopoulos A. N. Nonlinear Digital Filters. London, UK: Kluwer, 1990.
[8] Wigren T. “Recursive prediction error identification using
the nonlinear Wiener model”. Automatica, 29:1011-1025,
1993.
[9] Nikias C. L. Higher-Order Spectra Analysis. Englewood
Cliffs, NJ: Prentice-Hall, 1993.
[10] Therrien C. Discrete Random Signal and Statistical Signal
Processing. Englewood Cliffs, NJ: Prentice-Hall, 1992.
[11] QUALCOMM Incorporation, An Overview of the Application of Code Division Multiple Access (CDMA) to Digital
Cellular Systems and Personal Cellular Networks (Document no. EX60-10010), 1992.
[12] Heinonen P. and Neuvo Y. “FIR-median hybrid filters with
predictive FIR substructures”. IEEE Trans. ASSP, 36(6):
892-899, 1988.
>5 @
5. SUMMARY
The computationally efficient PE based on the WM has been proposed for complex signals. PE output is guaranteed to be positive,
as desired for all applications requiring power estimation. Also,
the PE can be designed to be predictive for delay sensitive control
applications for which 5<N<21 is found adequate. Two optimum
design methods have been derived, and of these the partial optimization method is of practical interest. In COSSAP software environment, the communication system simulations have been carried
out to compare the behaviors of three controllers with or without
PE. The results demonstrate obvious benefits of employing PE
rather than power measurement when input SNR is low, and the
advantage of using the partially-optimized PE over using the PE
with conventional filters/predictors is clearly seen. In practice, an
adaptive algorithm can be used to adjust the partially-optimized
PE to suit for actual channel variation and SNR >6@.
6. ACKNOWLEDGMENT
This project was financed by the Technology Development Centre
of Finland (TEKES), Nokia Corporation, Telecom Finland, and
Helsinki Telephone Company, Finland.
[1]
[2]
[3]
[4]
7. REFERENCES
Sicuranza G. “Quadratic filters for signal processing”. Proc.
of the IEEE, 80(8):1263-1285, 1992.
Fang J. and Atlas L. E. “Quadratic detectors for energy estimation”. IEEE Trans. Signal Processing, 43(11):25822594, 1995.
Gilhousen K., Jacobs I., Padovani R., Viterbi A. J., Weaver
L. A., Jr., and Wheatley III C. E. “On the capacity of a cellular CDMA system”. IEEE Trans. Vehicular Technology,
40:303-312, 1991.
Tonguz O. K. and Wang M. M. “Cellular CDMA networks
impaired by Rayleigh fading: system performance with
power control”. IEEE Trans. Vehicular Technology, 43:515-
8. APPENDICES
1. As stated in the text, wR(n)a(0, V w /2), wI(n)a(0, V w /2). The
2
2
kurtosis of wR(n) or wI(n) is then E{ wR4 (n)}= E{ wI4 (n)} = 3 V w4 /4
[9]. The mean, variance and kurtosis of w(n) can be derived as
E{w(n)} = E{wR(n)} + jE{wI(n)} = 0,
2
E{|w(n)|2} = E{ w R2 ( n ) }+ E{ w I2 ( n ) } = V w ,
E{|w(n)|4}=E{ wR4 (n)}+2E{ wR2 (n)}E{ wI2 (n)}+E{ wI4 (n)}= 2 V w4 .
2. Equation (3) can be rewritten as y(n) = hTSh where S = S*T =
(x+w)(x+w)*T is a Hermitian matrix. Taking the partial derivative
of y(n) with respect to h yields wy(n)/wh = (S+S*)h >10@. Hence,
the partial derivatives of the three terms in (6) can be derived as
wE{y2(n)}/w h = E{2y(n)wy(n)/wh}= 2E{(S+S*)hhTSh},
wE{y(n)|x(n+p)|2}/wh = E{|x(n+p)|2wy(n)/wh}
= E{|x(n+p)|2(S+S*)h},
wE{|x(n+p)|4}/wh = 0,
and (7) then stands.
3. Utilizing the equality r(n) = hT(x+w) = x(n+p)+H(n), (4) and (5)
can be further derived as
e(n) = x(n+p)H*(n) + x*(n+p)H(n) + H(n)H*(n)
= 2xR(n+p)HR(n) + 2xI(n+p)HI(n) + H R2 (n)+ H I2 (n).
Bias = 4E{xR(n+p)HR(n)}+2E{ H R2 (n)}
= 4hTE{xR(n+p)xR}4E{xR(n+p)xR(n+p)}+2E{ H R2 (n)}
(A.1)
= 4>hTrxR Rx(0)/2@+2E{ H R2 (n)}
The first equality in (A.1) stands because of the equal-statistics assumptions on wR(n) and wI(n), and on xR(n) and xI(n). The second
equality stands since wR(n) is a zero-mean Gaussian process. The
last quality stands due to the definitions of rxR and RR(0) in Section 3.2. In the case of using Wiener filters, replacing h by hopt,
replacing E{ H R2 (n)} by E{ H R2 (n)}min, utilizing (11) yields (12).

